Spanish vs Immigrants from Oceania In Labor Force | Age 35-44
COMPARE
Spanish
Immigrants from Oceania
In Labor Force | Age 35-44
In Labor Force | Age 35-44 Comparison
Spanish
Immigrants from Oceania
83.2%
IN LABOR FORCE | AGE 35-44
0.0/ 100
METRIC RATING
273rd/ 347
METRIC RANK
83.9%
IN LABOR FORCE | AGE 35-44
2.6/ 100
METRIC RATING
234th/ 347
METRIC RANK
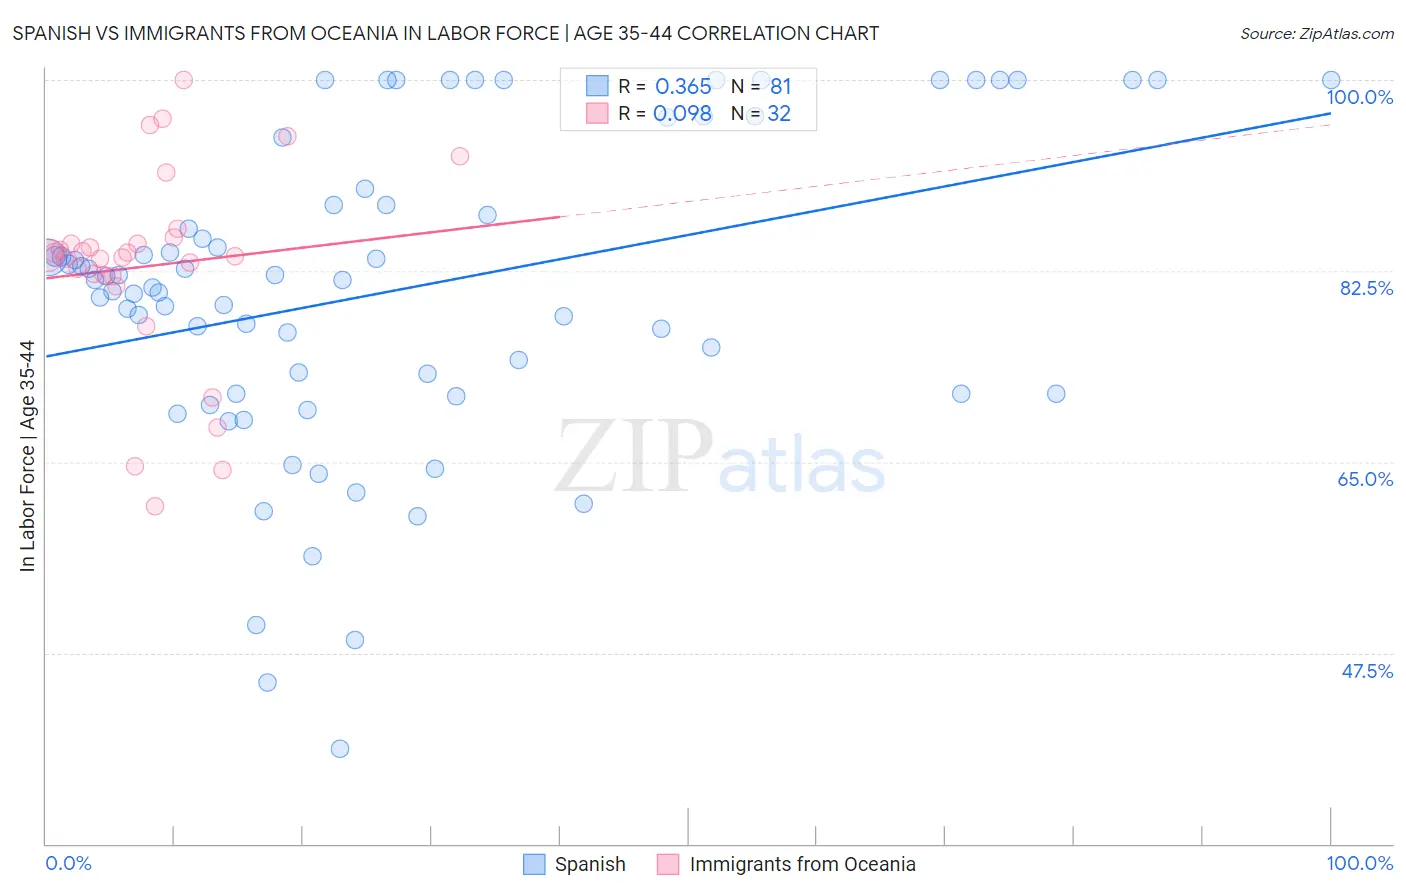
Spanish vs Immigrants from Oceania In Labor Force | Age 35-44 Correlation Chart
The statistical analysis conducted on geographies consisting of 421,966,219 people shows a mild positive correlation between the proportion of Spanish and labor force participation rate among population between the ages 35 and 44 in the United States with a correlation coefficient (R) of 0.365 and weighted average of 83.2%. Similarly, the statistical analysis conducted on geographies consisting of 305,435,378 people shows a slight positive correlation between the proportion of Immigrants from Oceania and labor force participation rate among population between the ages 35 and 44 in the United States with a correlation coefficient (R) of 0.098 and weighted average of 83.9%, a difference of 0.77%.
In Labor Force | Age 35-44 Correlation Summary
| Measurement | Spanish | Immigrants from Oceania |
| Minimum | 38.7% | 61.0% |
| Maximum | 100.0% | 100.0% |
| Range | 61.3% | 39.0% |
| Mean | 80.7% | 82.9% |
| Median | 81.7% | 83.9% |
| Interquartile 25% (IQ1) | 71.3% | 82.0% |
| Interquartile 75% (IQ3) | 89.3% | 85.3% |
| Interquartile Range (IQR) | 18.0% | 3.3% |
| Standard Deviation (Sample) | 14.2% | 9.1% |
| Standard Deviation (Population) | 14.1% | 9.0% |
Similar Demographics by In Labor Force | Age 35-44
Demographics Similar to Spanish by In Labor Force | Age 35-44
In terms of in labor force | age 35-44, the demographic groups most similar to Spanish are Immigrants from Fiji (83.2%, a difference of 0.0%), Immigrants from Honduras (83.3%, a difference of 0.020%), French American Indian (83.2%, a difference of 0.020%), Nonimmigrants (83.2%, a difference of 0.020%), and Hawaiian (83.2%, a difference of 0.030%).
| Demographics | Rating | Rank | In Labor Force | Age 35-44 |
| Spaniards | 0.1 /100 | #266 | Tragic 83.4% |
| Guamanians/Chamorros | 0.1 /100 | #267 | Tragic 83.4% |
| Hondurans | 0.1 /100 | #268 | Tragic 83.4% |
| Immigrants | Grenada | 0.1 /100 | #269 | Tragic 83.3% |
| Immigrants | Honduras | 0.0 /100 | #270 | Tragic 83.3% |
| French American Indians | 0.0 /100 | #271 | Tragic 83.2% |
| Immigrants | Fiji | 0.0 /100 | #272 | Tragic 83.2% |
| Spanish | 0.0 /100 | #273 | Tragic 83.2% |
| Immigrants | Nonimmigrants | 0.0 /100 | #274 | Tragic 83.2% |
| Hawaiians | 0.0 /100 | #275 | Tragic 83.2% |
| Delaware | 0.0 /100 | #276 | Tragic 83.2% |
| Samoans | 0.0 /100 | #277 | Tragic 83.2% |
| Belizeans | 0.0 /100 | #278 | Tragic 83.1% |
| Immigrants | Micronesia | 0.0 /100 | #279 | Tragic 83.1% |
| Dominicans | 0.0 /100 | #280 | Tragic 83.1% |
Demographics Similar to Immigrants from Oceania by In Labor Force | Age 35-44
In terms of in labor force | age 35-44, the demographic groups most similar to Immigrants from Oceania are Immigrants from Germany (83.9%, a difference of 0.010%), Immigrants from Syria (83.9%, a difference of 0.010%), Native Hawaiian (83.9%, a difference of 0.020%), West Indian (83.9%, a difference of 0.020%), and Scottish (83.9%, a difference of 0.030%).
| Demographics | Rating | Rank | In Labor Force | Age 35-44 |
| British West Indians | 5.3 /100 | #227 | Tragic 84.0% |
| Welsh | 5.3 /100 | #228 | Tragic 84.0% |
| Immigrants | Thailand | 4.7 /100 | #229 | Tragic 84.0% |
| Immigrants | Iraq | 3.7 /100 | #230 | Tragic 83.9% |
| Scottish | 3.2 /100 | #231 | Tragic 83.9% |
| Native Hawaiians | 3.0 /100 | #232 | Tragic 83.9% |
| Immigrants | Germany | 2.8 /100 | #233 | Tragic 83.9% |
| Immigrants | Oceania | 2.6 /100 | #234 | Tragic 83.9% |
| Immigrants | Syria | 2.5 /100 | #235 | Tragic 83.9% |
| West Indians | 2.4 /100 | #236 | Tragic 83.9% |
| English | 1.8 /100 | #237 | Tragic 83.8% |
| Immigrants | Laos | 1.7 /100 | #238 | Tragic 83.8% |
| Celtics | 1.4 /100 | #239 | Tragic 83.8% |
| Arabs | 1.3 /100 | #240 | Tragic 83.8% |
| Iraqis | 1.3 /100 | #241 | Tragic 83.8% |