Spanish vs Carpatho Rusyn In Labor Force | Age 35-44
COMPARE
Spanish
Carpatho Rusyn
In Labor Force | Age 35-44
In Labor Force | Age 35-44 Comparison
Spanish
Carpatho Rusyns
83.2%
IN LABOR FORCE | AGE 35-44
0.0/ 100
METRIC RATING
273rd/ 347
METRIC RANK
85.6%
IN LABOR FORCE | AGE 35-44
100.0/ 100
METRIC RATING
18th/ 347
METRIC RANK
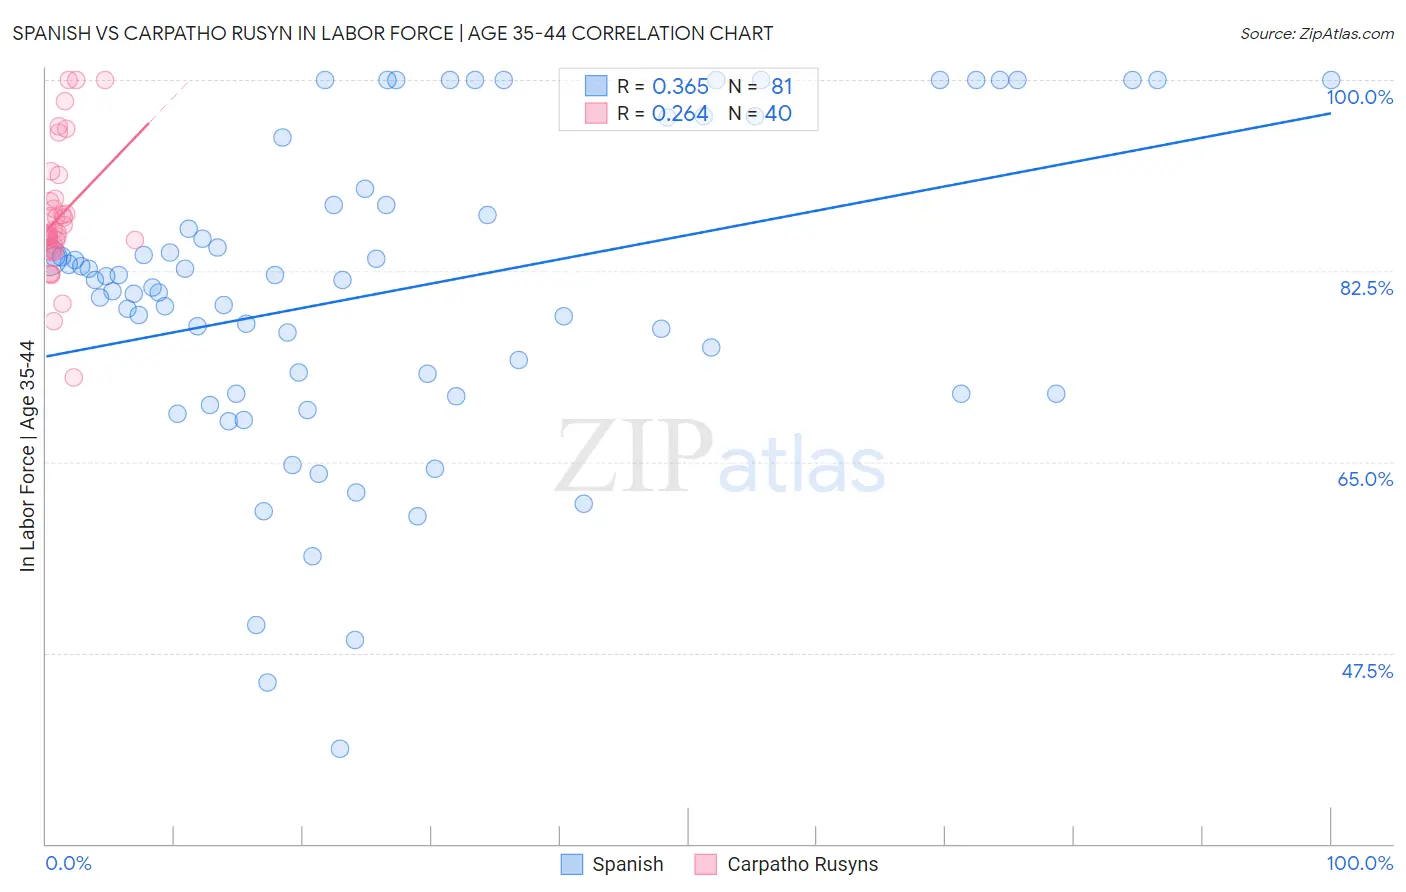
Spanish vs Carpatho Rusyn In Labor Force | Age 35-44 Correlation Chart
The statistical analysis conducted on geographies consisting of 421,966,219 people shows a mild positive correlation between the proportion of Spanish and labor force participation rate among population between the ages 35 and 44 in the United States with a correlation coefficient (R) of 0.365 and weighted average of 83.2%. Similarly, the statistical analysis conducted on geographies consisting of 58,868,211 people shows a weak positive correlation between the proportion of Carpatho Rusyns and labor force participation rate among population between the ages 35 and 44 in the United States with a correlation coefficient (R) of 0.264 and weighted average of 85.6%, a difference of 2.8%.
In Labor Force | Age 35-44 Correlation Summary
| Measurement | Spanish | Carpatho Rusyn |
| Minimum | 38.7% | 72.7% |
| Maximum | 100.0% | 100.0% |
| Range | 61.3% | 27.3% |
| Mean | 80.7% | 87.5% |
| Median | 81.7% | 86.0% |
| Interquartile 25% (IQ1) | 71.3% | 84.6% |
| Interquartile 75% (IQ3) | 89.3% | 89.0% |
| Interquartile Range (IQR) | 18.0% | 4.4% |
| Standard Deviation (Sample) | 14.2% | 5.9% |
| Standard Deviation (Population) | 14.1% | 5.8% |
Similar Demographics by In Labor Force | Age 35-44
Demographics Similar to Spanish by In Labor Force | Age 35-44
In terms of in labor force | age 35-44, the demographic groups most similar to Spanish are Immigrants from Fiji (83.2%, a difference of 0.0%), Immigrants from Honduras (83.3%, a difference of 0.020%), French American Indian (83.2%, a difference of 0.020%), Nonimmigrants (83.2%, a difference of 0.020%), and Hawaiian (83.2%, a difference of 0.030%).
| Demographics | Rating | Rank | In Labor Force | Age 35-44 |
| Spaniards | 0.1 /100 | #266 | Tragic 83.4% |
| Guamanians/Chamorros | 0.1 /100 | #267 | Tragic 83.4% |
| Hondurans | 0.1 /100 | #268 | Tragic 83.4% |
| Immigrants | Grenada | 0.1 /100 | #269 | Tragic 83.3% |
| Immigrants | Honduras | 0.0 /100 | #270 | Tragic 83.3% |
| French American Indians | 0.0 /100 | #271 | Tragic 83.2% |
| Immigrants | Fiji | 0.0 /100 | #272 | Tragic 83.2% |
| Spanish | 0.0 /100 | #273 | Tragic 83.2% |
| Immigrants | Nonimmigrants | 0.0 /100 | #274 | Tragic 83.2% |
| Hawaiians | 0.0 /100 | #275 | Tragic 83.2% |
| Delaware | 0.0 /100 | #276 | Tragic 83.2% |
| Samoans | 0.0 /100 | #277 | Tragic 83.2% |
| Belizeans | 0.0 /100 | #278 | Tragic 83.1% |
| Immigrants | Micronesia | 0.0 /100 | #279 | Tragic 83.1% |
| Dominicans | 0.0 /100 | #280 | Tragic 83.1% |
Demographics Similar to Carpatho Rusyns by In Labor Force | Age 35-44
In terms of in labor force | age 35-44, the demographic groups most similar to Carpatho Rusyns are Immigrants from North Macedonia (85.6%, a difference of 0.0%), Slovene (85.6%, a difference of 0.0%), Norwegian (85.6%, a difference of 0.050%), Immigrants from Ireland (85.6%, a difference of 0.050%), and Immigrants from Serbia (85.5%, a difference of 0.050%).
| Demographics | Rating | Rank | In Labor Force | Age 35-44 |
| Immigrants | Cameroon | 100.0 /100 | #11 | Exceptional 85.8% |
| Liberians | 100.0 /100 | #12 | Exceptional 85.7% |
| Somalis | 100.0 /100 | #13 | Exceptional 85.6% |
| Immigrants | Somalia | 100.0 /100 | #14 | Exceptional 85.6% |
| Norwegians | 100.0 /100 | #15 | Exceptional 85.6% |
| Immigrants | Ireland | 100.0 /100 | #16 | Exceptional 85.6% |
| Immigrants | North Macedonia | 100.0 /100 | #17 | Exceptional 85.6% |
| Carpatho Rusyns | 100.0 /100 | #18 | Exceptional 85.6% |
| Slovenes | 100.0 /100 | #19 | Exceptional 85.6% |
| Immigrants | Serbia | 100.0 /100 | #20 | Exceptional 85.5% |
| Bulgarians | 100.0 /100 | #21 | Exceptional 85.5% |
| Immigrants | Bosnia and Herzegovina | 100.0 /100 | #22 | Exceptional 85.4% |
| Immigrants | Eastern Africa | 100.0 /100 | #23 | Exceptional 85.4% |
| Latvians | 99.9 /100 | #24 | Exceptional 85.4% |
| Paraguayans | 99.9 /100 | #25 | Exceptional 85.4% |