Immigrants from Romania vs Immigrants from Oceania In Labor Force | Age 35-44
COMPARE
Immigrants from Romania
Immigrants from Oceania
In Labor Force | Age 35-44
In Labor Force | Age 35-44 Comparison
Immigrants from Romania
Immigrants from Oceania
84.8%
IN LABOR FORCE | AGE 35-44
94.7/ 100
METRIC RATING
107th/ 347
METRIC RANK
83.9%
IN LABOR FORCE | AGE 35-44
2.6/ 100
METRIC RATING
234th/ 347
METRIC RANK
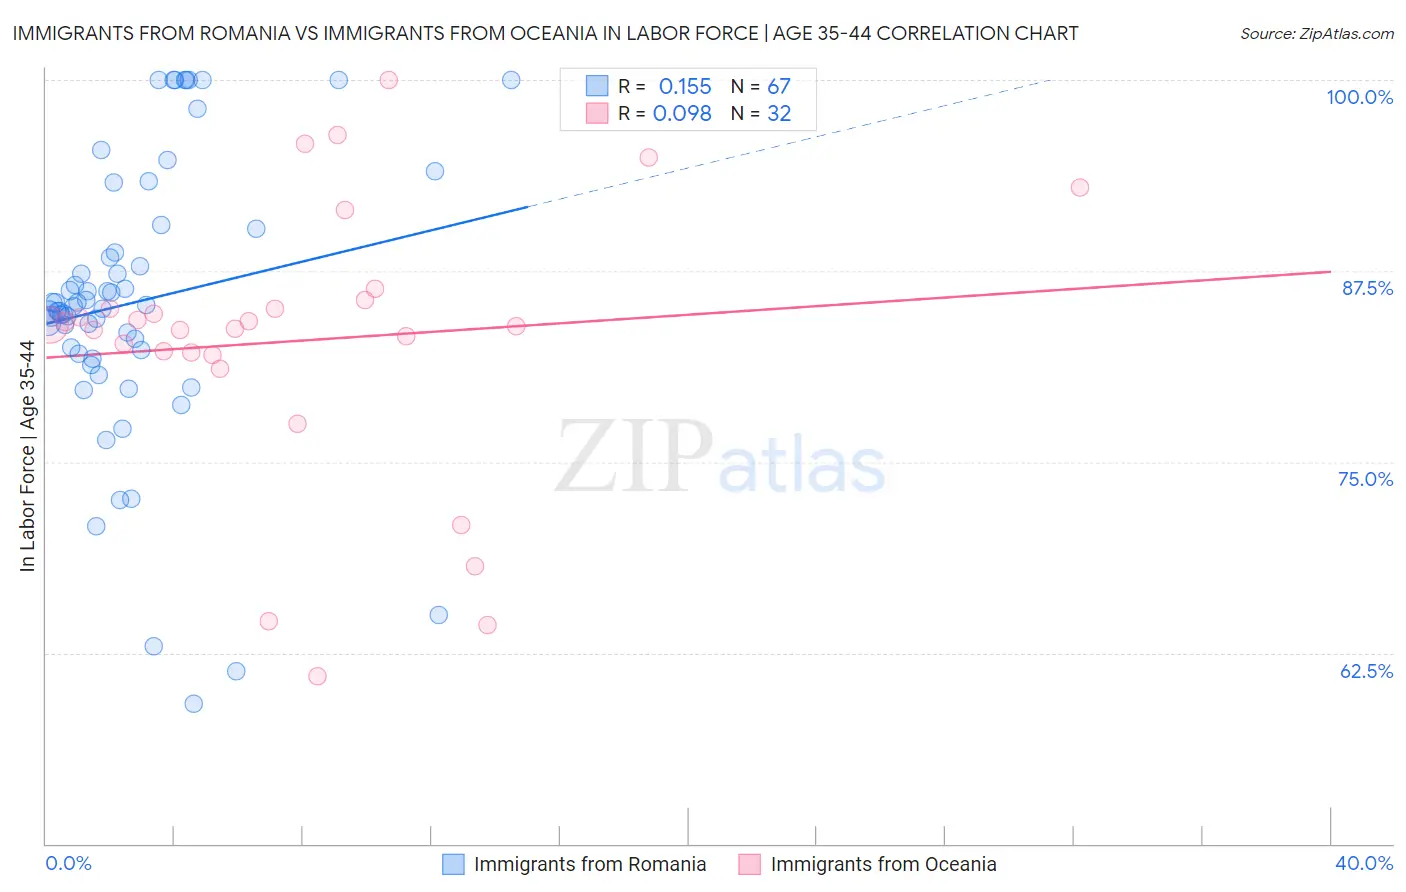
Immigrants from Romania vs Immigrants from Oceania In Labor Force | Age 35-44 Correlation Chart
The statistical analysis conducted on geographies consisting of 256,974,600 people shows a poor positive correlation between the proportion of Immigrants from Romania and labor force participation rate among population between the ages 35 and 44 in the United States with a correlation coefficient (R) of 0.155 and weighted average of 84.8%. Similarly, the statistical analysis conducted on geographies consisting of 305,435,378 people shows a slight positive correlation between the proportion of Immigrants from Oceania and labor force participation rate among population between the ages 35 and 44 in the United States with a correlation coefficient (R) of 0.098 and weighted average of 83.9%, a difference of 1.1%.
In Labor Force | Age 35-44 Correlation Summary
| Measurement | Immigrants from Romania | Immigrants from Oceania |
| Minimum | 59.2% | 61.0% |
| Maximum | 100.0% | 100.0% |
| Range | 40.8% | 39.0% |
| Mean | 85.5% | 82.9% |
| Median | 85.2% | 83.9% |
| Interquartile 25% (IQ1) | 82.1% | 82.0% |
| Interquartile 75% (IQ3) | 90.3% | 85.3% |
| Interquartile Range (IQR) | 8.2% | 3.3% |
| Standard Deviation (Sample) | 9.3% | 9.1% |
| Standard Deviation (Population) | 9.2% | 9.0% |
Similar Demographics by In Labor Force | Age 35-44
Demographics Similar to Immigrants from Romania by In Labor Force | Age 35-44
In terms of in labor force | age 35-44, the demographic groups most similar to Immigrants from Romania are Immigrants from Bahamas (84.8%, a difference of 0.0%), South American (84.8%, a difference of 0.010%), Immigrants from Argentina (84.8%, a difference of 0.010%), Immigrants from Russia (84.8%, a difference of 0.010%), and Immigrants from Southern Europe (84.8%, a difference of 0.020%).
| Demographics | Rating | Rank | In Labor Force | Age 35-44 |
| Immigrants | Czechoslovakia | 95.9 /100 | #100 | Exceptional 84.8% |
| Immigrants | Australia | 95.5 /100 | #101 | Exceptional 84.8% |
| Immigrants | Southern Europe | 95.3 /100 | #102 | Exceptional 84.8% |
| Immigrants | Belarus | 95.3 /100 | #103 | Exceptional 84.8% |
| Immigrants | Sweden | 95.2 /100 | #104 | Exceptional 84.8% |
| South Americans | 95.0 /100 | #105 | Exceptional 84.8% |
| Immigrants | Bahamas | 94.8 /100 | #106 | Exceptional 84.8% |
| Immigrants | Romania | 94.7 /100 | #107 | Exceptional 84.8% |
| Immigrants | Argentina | 94.5 /100 | #108 | Exceptional 84.8% |
| Immigrants | Russia | 94.5 /100 | #109 | Exceptional 84.8% |
| Filipinos | 93.8 /100 | #110 | Exceptional 84.7% |
| Ukrainians | 93.5 /100 | #111 | Exceptional 84.7% |
| Immigrants | Western Africa | 93.4 /100 | #112 | Exceptional 84.7% |
| Uruguayans | 93.3 /100 | #113 | Exceptional 84.7% |
| Chileans | 93.2 /100 | #114 | Exceptional 84.7% |
Demographics Similar to Immigrants from Oceania by In Labor Force | Age 35-44
In terms of in labor force | age 35-44, the demographic groups most similar to Immigrants from Oceania are Immigrants from Germany (83.9%, a difference of 0.010%), Immigrants from Syria (83.9%, a difference of 0.010%), Native Hawaiian (83.9%, a difference of 0.020%), West Indian (83.9%, a difference of 0.020%), and Scottish (83.9%, a difference of 0.030%).
| Demographics | Rating | Rank | In Labor Force | Age 35-44 |
| British West Indians | 5.3 /100 | #227 | Tragic 84.0% |
| Welsh | 5.3 /100 | #228 | Tragic 84.0% |
| Immigrants | Thailand | 4.7 /100 | #229 | Tragic 84.0% |
| Immigrants | Iraq | 3.7 /100 | #230 | Tragic 83.9% |
| Scottish | 3.2 /100 | #231 | Tragic 83.9% |
| Native Hawaiians | 3.0 /100 | #232 | Tragic 83.9% |
| Immigrants | Germany | 2.8 /100 | #233 | Tragic 83.9% |
| Immigrants | Oceania | 2.6 /100 | #234 | Tragic 83.9% |
| Immigrants | Syria | 2.5 /100 | #235 | Tragic 83.9% |
| West Indians | 2.4 /100 | #236 | Tragic 83.9% |
| English | 1.8 /100 | #237 | Tragic 83.8% |
| Immigrants | Laos | 1.7 /100 | #238 | Tragic 83.8% |
| Celtics | 1.4 /100 | #239 | Tragic 83.8% |
| Arabs | 1.3 /100 | #240 | Tragic 83.8% |
| Iraqis | 1.3 /100 | #241 | Tragic 83.8% |