Spanish vs Apache In Labor Force | Age 35-44
COMPARE
Spanish
Apache
In Labor Force | Age 35-44
In Labor Force | Age 35-44 Comparison
Spanish
Apache
83.2%
IN LABOR FORCE | AGE 35-44
0.0/ 100
METRIC RATING
273rd/ 347
METRIC RANK
77.9%
IN LABOR FORCE | AGE 35-44
0.0/ 100
METRIC RATING
337th/ 347
METRIC RANK
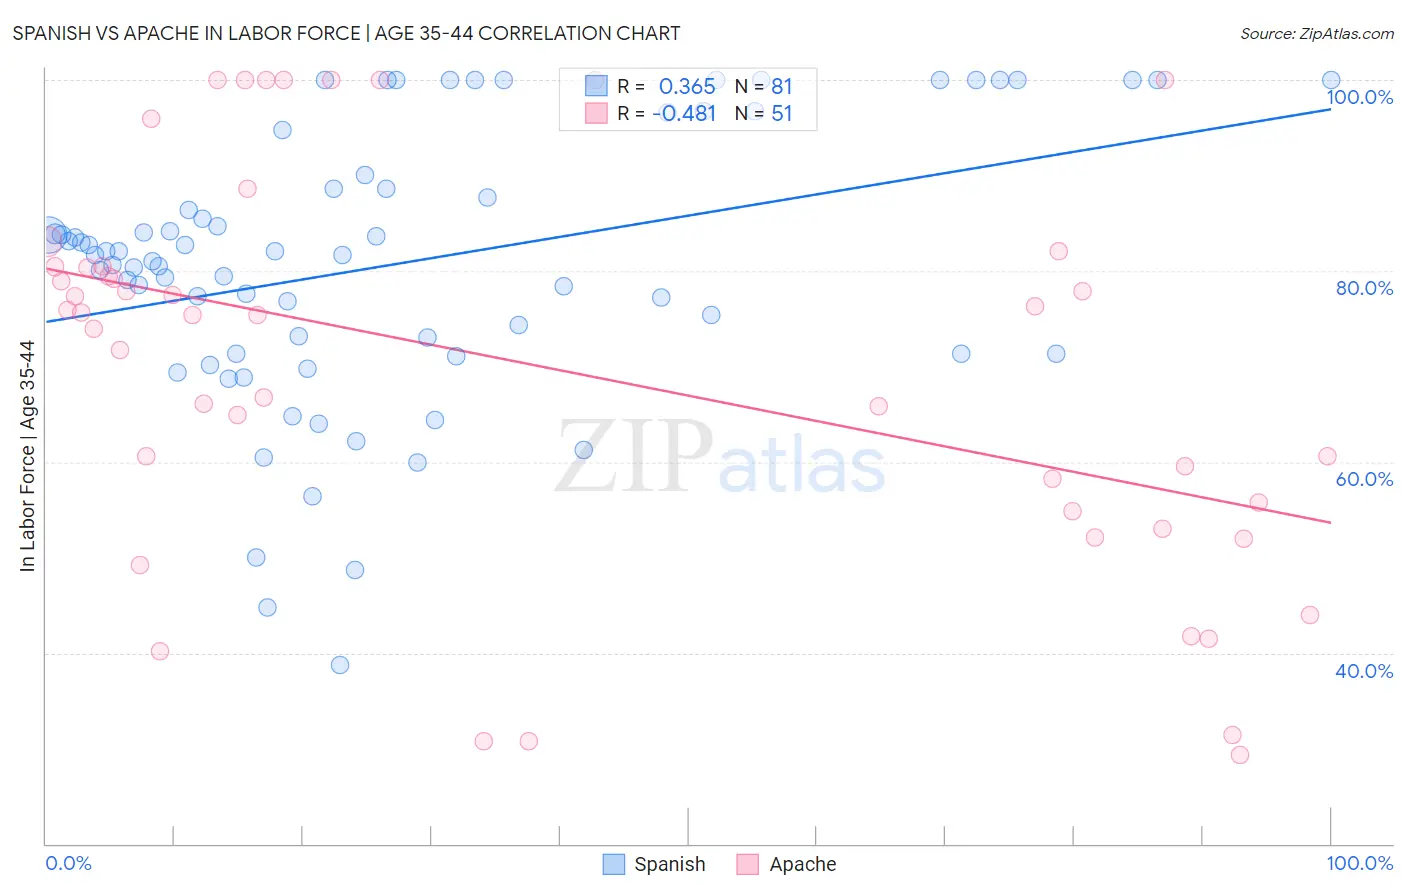
Spanish vs Apache In Labor Force | Age 35-44 Correlation Chart
The statistical analysis conducted on geographies consisting of 421,966,219 people shows a mild positive correlation between the proportion of Spanish and labor force participation rate among population between the ages 35 and 44 in the United States with a correlation coefficient (R) of 0.365 and weighted average of 83.2%. Similarly, the statistical analysis conducted on geographies consisting of 231,077,330 people shows a moderate negative correlation between the proportion of Apache and labor force participation rate among population between the ages 35 and 44 in the United States with a correlation coefficient (R) of -0.481 and weighted average of 77.9%, a difference of 6.9%.
In Labor Force | Age 35-44 Correlation Summary
| Measurement | Spanish | Apache |
| Minimum | 38.7% | 29.3% |
| Maximum | 100.0% | 100.0% |
| Range | 61.3% | 70.7% |
| Mean | 80.7% | 70.1% |
| Median | 81.7% | 75.4% |
| Interquartile 25% (IQ1) | 71.3% | 54.8% |
| Interquartile 75% (IQ3) | 89.3% | 80.5% |
| Interquartile Range (IQR) | 18.0% | 25.7% |
| Standard Deviation (Sample) | 14.2% | 20.6% |
| Standard Deviation (Population) | 14.1% | 20.4% |
Similar Demographics by In Labor Force | Age 35-44
Demographics Similar to Spanish by In Labor Force | Age 35-44
In terms of in labor force | age 35-44, the demographic groups most similar to Spanish are Immigrants from Fiji (83.2%, a difference of 0.0%), Immigrants from Honduras (83.3%, a difference of 0.020%), French American Indian (83.2%, a difference of 0.020%), Nonimmigrants (83.2%, a difference of 0.020%), and Hawaiian (83.2%, a difference of 0.030%).
| Demographics | Rating | Rank | In Labor Force | Age 35-44 |
| Spaniards | 0.1 /100 | #266 | Tragic 83.4% |
| Guamanians/Chamorros | 0.1 /100 | #267 | Tragic 83.4% |
| Hondurans | 0.1 /100 | #268 | Tragic 83.4% |
| Immigrants | Grenada | 0.1 /100 | #269 | Tragic 83.3% |
| Immigrants | Honduras | 0.0 /100 | #270 | Tragic 83.3% |
| French American Indians | 0.0 /100 | #271 | Tragic 83.2% |
| Immigrants | Fiji | 0.0 /100 | #272 | Tragic 83.2% |
| Spanish | 0.0 /100 | #273 | Tragic 83.2% |
| Immigrants | Nonimmigrants | 0.0 /100 | #274 | Tragic 83.2% |
| Hawaiians | 0.0 /100 | #275 | Tragic 83.2% |
| Delaware | 0.0 /100 | #276 | Tragic 83.2% |
| Samoans | 0.0 /100 | #277 | Tragic 83.2% |
| Belizeans | 0.0 /100 | #278 | Tragic 83.1% |
| Immigrants | Micronesia | 0.0 /100 | #279 | Tragic 83.1% |
| Dominicans | 0.0 /100 | #280 | Tragic 83.1% |
Demographics Similar to Apache by In Labor Force | Age 35-44
In terms of in labor force | age 35-44, the demographic groups most similar to Apache are Arapaho (78.1%, a difference of 0.21%), Pueblo (77.4%, a difference of 0.70%), Yup'ik (77.3%, a difference of 0.81%), Lumbee (77.0%, a difference of 1.2%), and Hopi (77.0%, a difference of 1.2%).
| Demographics | Rating | Rank | In Labor Force | Age 35-44 |
| Cheyenne | 0.0 /100 | #330 | Tragic 79.5% |
| Houma | 0.0 /100 | #331 | Tragic 79.5% |
| Ute | 0.0 /100 | #332 | Tragic 79.4% |
| Kiowa | 0.0 /100 | #333 | Tragic 79.2% |
| Yakama | 0.0 /100 | #334 | Tragic 79.0% |
| Natives/Alaskans | 0.0 /100 | #335 | Tragic 78.9% |
| Arapaho | 0.0 /100 | #336 | Tragic 78.1% |
| Apache | 0.0 /100 | #337 | Tragic 77.9% |
| Pueblo | 0.0 /100 | #338 | Tragic 77.4% |
| Yup'ik | 0.0 /100 | #339 | Tragic 77.3% |
| Lumbee | 0.0 /100 | #340 | Tragic 77.0% |
| Hopi | 0.0 /100 | #341 | Tragic 77.0% |
| Crow | 0.0 /100 | #342 | Tragic 76.5% |
| Immigrants | Yemen | 0.0 /100 | #343 | Tragic 76.3% |
| Pima | 0.0 /100 | #344 | Tragic 74.8% |