Spanish vs Nepalese In Labor Force | Age 35-44
COMPARE
Spanish
Nepalese
In Labor Force | Age 35-44
In Labor Force | Age 35-44 Comparison
Spanish
Nepalese
83.2%
IN LABOR FORCE | AGE 35-44
0.0/ 100
METRIC RATING
273rd/ 347
METRIC RANK
82.4%
IN LABOR FORCE | AGE 35-44
0.0/ 100
METRIC RATING
303rd/ 347
METRIC RANK
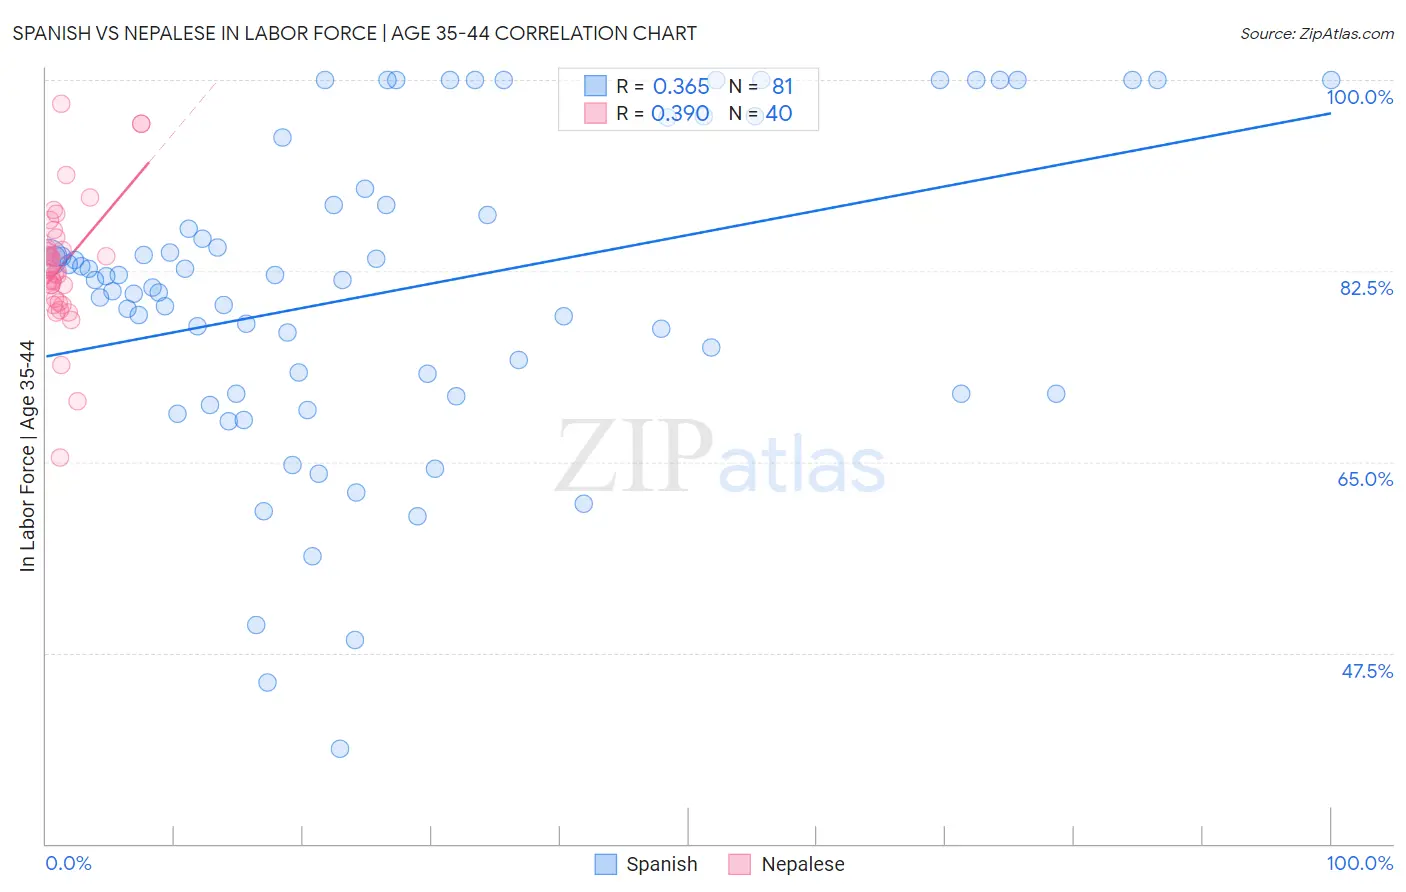
Spanish vs Nepalese In Labor Force | Age 35-44 Correlation Chart
The statistical analysis conducted on geographies consisting of 421,966,219 people shows a mild positive correlation between the proportion of Spanish and labor force participation rate among population between the ages 35 and 44 in the United States with a correlation coefficient (R) of 0.365 and weighted average of 83.2%. Similarly, the statistical analysis conducted on geographies consisting of 24,521,755 people shows a mild positive correlation between the proportion of Nepalese and labor force participation rate among population between the ages 35 and 44 in the United States with a correlation coefficient (R) of 0.390 and weighted average of 82.4%, a difference of 1.0%.
In Labor Force | Age 35-44 Correlation Summary
| Measurement | Spanish | Nepalese |
| Minimum | 38.7% | 65.4% |
| Maximum | 100.0% | 97.8% |
| Range | 61.3% | 32.4% |
| Mean | 80.7% | 83.0% |
| Median | 81.7% | 82.5% |
| Interquartile 25% (IQ1) | 71.3% | 79.8% |
| Interquartile 75% (IQ3) | 89.3% | 85.1% |
| Interquartile Range (IQR) | 18.0% | 5.3% |
| Standard Deviation (Sample) | 14.2% | 6.1% |
| Standard Deviation (Population) | 14.1% | 6.0% |
Similar Demographics by In Labor Force | Age 35-44
Demographics Similar to Spanish by In Labor Force | Age 35-44
In terms of in labor force | age 35-44, the demographic groups most similar to Spanish are Immigrants from Fiji (83.2%, a difference of 0.0%), Immigrants from Honduras (83.3%, a difference of 0.020%), French American Indian (83.2%, a difference of 0.020%), Nonimmigrants (83.2%, a difference of 0.020%), and Hawaiian (83.2%, a difference of 0.030%).
| Demographics | Rating | Rank | In Labor Force | Age 35-44 |
| Spaniards | 0.1 /100 | #266 | Tragic 83.4% |
| Guamanians/Chamorros | 0.1 /100 | #267 | Tragic 83.4% |
| Hondurans | 0.1 /100 | #268 | Tragic 83.4% |
| Immigrants | Grenada | 0.1 /100 | #269 | Tragic 83.3% |
| Immigrants | Honduras | 0.0 /100 | #270 | Tragic 83.3% |
| French American Indians | 0.0 /100 | #271 | Tragic 83.2% |
| Immigrants | Fiji | 0.0 /100 | #272 | Tragic 83.2% |
| Spanish | 0.0 /100 | #273 | Tragic 83.2% |
| Immigrants | Nonimmigrants | 0.0 /100 | #274 | Tragic 83.2% |
| Hawaiians | 0.0 /100 | #275 | Tragic 83.2% |
| Delaware | 0.0 /100 | #276 | Tragic 83.2% |
| Samoans | 0.0 /100 | #277 | Tragic 83.2% |
| Belizeans | 0.0 /100 | #278 | Tragic 83.1% |
| Immigrants | Micronesia | 0.0 /100 | #279 | Tragic 83.1% |
| Dominicans | 0.0 /100 | #280 | Tragic 83.1% |
Demographics Similar to Nepalese by In Labor Force | Age 35-44
In terms of in labor force | age 35-44, the demographic groups most similar to Nepalese are American (82.4%, a difference of 0.0%), Marshallese (82.4%, a difference of 0.010%), Spanish American Indian (82.5%, a difference of 0.080%), Central American Indian (82.5%, a difference of 0.10%), and Tlingit-Haida (82.5%, a difference of 0.16%).
| Demographics | Rating | Rank | In Labor Force | Age 35-44 |
| Mexican American Indians | 0.0 /100 | #296 | Tragic 82.6% |
| Hmong | 0.0 /100 | #297 | Tragic 82.6% |
| Ottawa | 0.0 /100 | #298 | Tragic 82.6% |
| Tlingit-Haida | 0.0 /100 | #299 | Tragic 82.5% |
| Central American Indians | 0.0 /100 | #300 | Tragic 82.5% |
| Spanish American Indians | 0.0 /100 | #301 | Tragic 82.5% |
| Americans | 0.0 /100 | #302 | Tragic 82.4% |
| Nepalese | 0.0 /100 | #303 | Tragic 82.4% |
| Marshallese | 0.0 /100 | #304 | Tragic 82.4% |
| Shoshone | 0.0 /100 | #305 | Tragic 82.2% |
| Blacks/African Americans | 0.0 /100 | #306 | Tragic 82.2% |
| Hispanics or Latinos | 0.0 /100 | #307 | Tragic 82.1% |
| Immigrants | Central America | 0.0 /100 | #308 | Tragic 82.0% |
| Cree | 0.0 /100 | #309 | Tragic 82.0% |
| Blackfeet | 0.0 /100 | #310 | Tragic 81.9% |