Spanish vs Immigrants from Nepal In Labor Force | Age 35-44
COMPARE
Spanish
Immigrants from Nepal
In Labor Force | Age 35-44
In Labor Force | Age 35-44 Comparison
Spanish
Immigrants from Nepal
83.2%
IN LABOR FORCE | AGE 35-44
0.0/ 100
METRIC RATING
273rd/ 347
METRIC RANK
85.3%
IN LABOR FORCE | AGE 35-44
99.9/ 100
METRIC RATING
34th/ 347
METRIC RANK
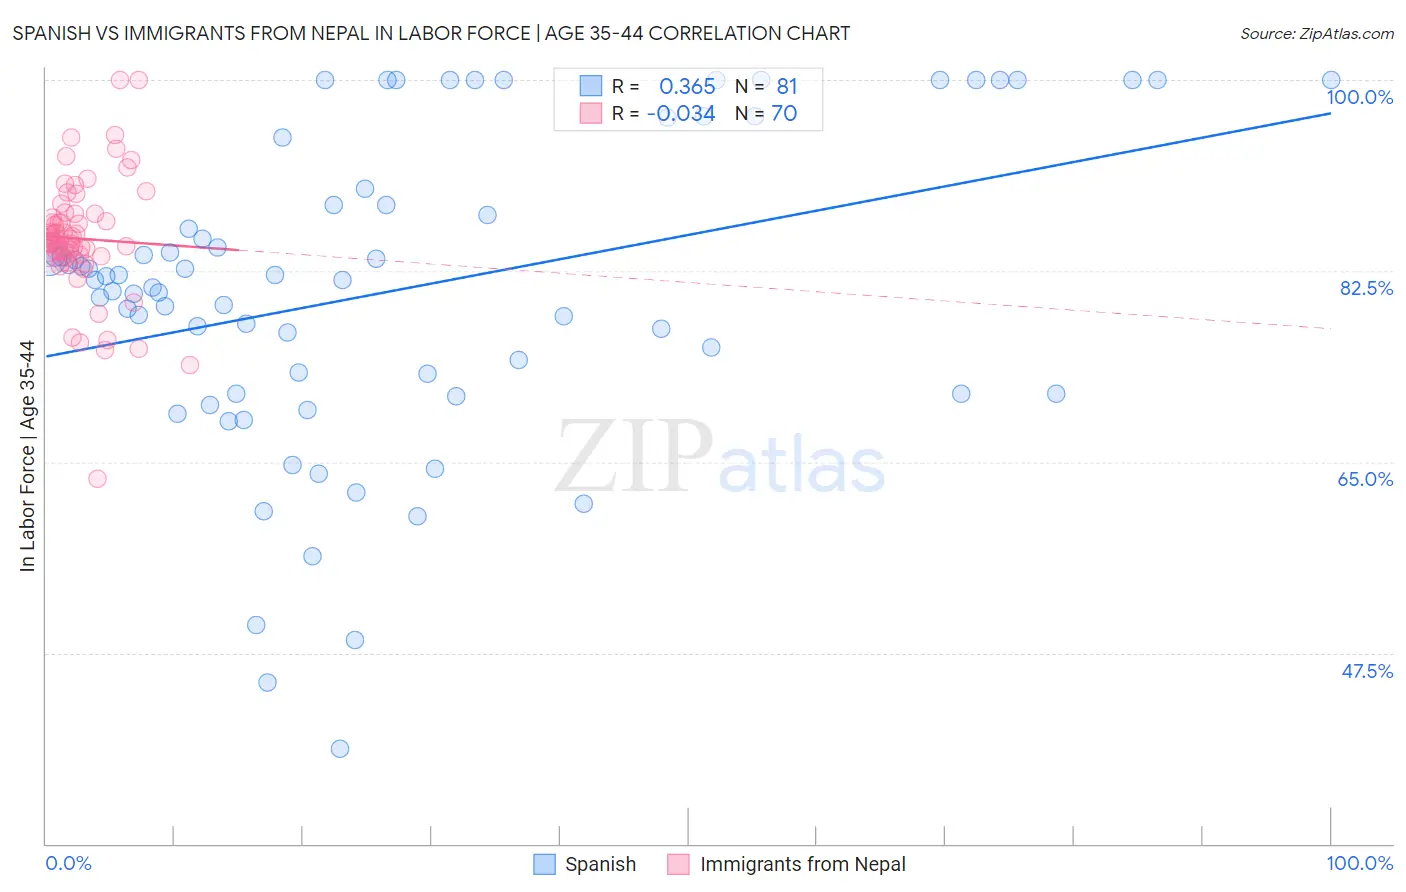
Spanish vs Immigrants from Nepal In Labor Force | Age 35-44 Correlation Chart
The statistical analysis conducted on geographies consisting of 421,966,219 people shows a mild positive correlation between the proportion of Spanish and labor force participation rate among population between the ages 35 and 44 in the United States with a correlation coefficient (R) of 0.365 and weighted average of 83.2%. Similarly, the statistical analysis conducted on geographies consisting of 186,726,251 people shows no correlation between the proportion of Immigrants from Nepal and labor force participation rate among population between the ages 35 and 44 in the United States with a correlation coefficient (R) of -0.034 and weighted average of 85.3%, a difference of 2.5%.
In Labor Force | Age 35-44 Correlation Summary
| Measurement | Spanish | Immigrants from Nepal |
| Minimum | 38.7% | 63.4% |
| Maximum | 100.0% | 100.0% |
| Range | 61.3% | 36.6% |
| Mean | 80.7% | 85.5% |
| Median | 81.7% | 85.2% |
| Interquartile 25% (IQ1) | 71.3% | 83.9% |
| Interquartile 75% (IQ3) | 89.3% | 87.7% |
| Interquartile Range (IQR) | 18.0% | 3.8% |
| Standard Deviation (Sample) | 14.2% | 5.7% |
| Standard Deviation (Population) | 14.1% | 5.6% |
Similar Demographics by In Labor Force | Age 35-44
Demographics Similar to Spanish by In Labor Force | Age 35-44
In terms of in labor force | age 35-44, the demographic groups most similar to Spanish are Immigrants from Fiji (83.2%, a difference of 0.0%), Immigrants from Honduras (83.3%, a difference of 0.020%), French American Indian (83.2%, a difference of 0.020%), Nonimmigrants (83.2%, a difference of 0.020%), and Hawaiian (83.2%, a difference of 0.030%).
| Demographics | Rating | Rank | In Labor Force | Age 35-44 |
| Spaniards | 0.1 /100 | #266 | Tragic 83.4% |
| Guamanians/Chamorros | 0.1 /100 | #267 | Tragic 83.4% |
| Hondurans | 0.1 /100 | #268 | Tragic 83.4% |
| Immigrants | Grenada | 0.1 /100 | #269 | Tragic 83.3% |
| Immigrants | Honduras | 0.0 /100 | #270 | Tragic 83.3% |
| French American Indians | 0.0 /100 | #271 | Tragic 83.2% |
| Immigrants | Fiji | 0.0 /100 | #272 | Tragic 83.2% |
| Spanish | 0.0 /100 | #273 | Tragic 83.2% |
| Immigrants | Nonimmigrants | 0.0 /100 | #274 | Tragic 83.2% |
| Hawaiians | 0.0 /100 | #275 | Tragic 83.2% |
| Delaware | 0.0 /100 | #276 | Tragic 83.2% |
| Samoans | 0.0 /100 | #277 | Tragic 83.2% |
| Belizeans | 0.0 /100 | #278 | Tragic 83.1% |
| Immigrants | Micronesia | 0.0 /100 | #279 | Tragic 83.1% |
| Dominicans | 0.0 /100 | #280 | Tragic 83.1% |
Demographics Similar to Immigrants from Nepal by In Labor Force | Age 35-44
In terms of in labor force | age 35-44, the demographic groups most similar to Immigrants from Nepal are Estonian (85.3%, a difference of 0.0%), Ugandan (85.3%, a difference of 0.020%), Czech (85.3%, a difference of 0.030%), Immigrants from India (85.3%, a difference of 0.030%), and Immigrants from Morocco (85.2%, a difference of 0.030%).
| Demographics | Rating | Rank | In Labor Force | Age 35-44 |
| Immigrants | Lithuania | 99.9 /100 | #27 | Exceptional 85.4% |
| Immigrants | Greece | 99.9 /100 | #28 | Exceptional 85.3% |
| Cambodians | 99.9 /100 | #29 | Exceptional 85.3% |
| Bermudans | 99.9 /100 | #30 | Exceptional 85.3% |
| Czechs | 99.9 /100 | #31 | Exceptional 85.3% |
| Immigrants | India | 99.9 /100 | #32 | Exceptional 85.3% |
| Ugandans | 99.9 /100 | #33 | Exceptional 85.3% |
| Immigrants | Nepal | 99.9 /100 | #34 | Exceptional 85.3% |
| Estonians | 99.9 /100 | #35 | Exceptional 85.3% |
| Immigrants | Morocco | 99.8 /100 | #36 | Exceptional 85.2% |
| Kenyans | 99.8 /100 | #37 | Exceptional 85.2% |
| Immigrants | Poland | 99.8 /100 | #38 | Exceptional 85.2% |
| Eastern Europeans | 99.8 /100 | #39 | Exceptional 85.2% |
| Immigrants | Bulgaria | 99.8 /100 | #40 | Exceptional 85.2% |
| Immigrants | Zimbabwe | 99.8 /100 | #41 | Exceptional 85.2% |