Spanish vs Immigrants from Oceania 4 or more Vehicles in Household
COMPARE
Spanish
Immigrants from Oceania
4 or more Vehicles in Household
4 or more Vehicles in Household Comparison
Spanish
Immigrants from Oceania
7.9%
4 OR MORE VEHICLES IN HOUSEHOLD
100.0/ 100
METRIC RATING
40th/ 347
METRIC RANK
7.6%
4 OR MORE VEHICLES IN HOUSEHOLD
100.0/ 100
METRIC RATING
55th/ 347
METRIC RANK
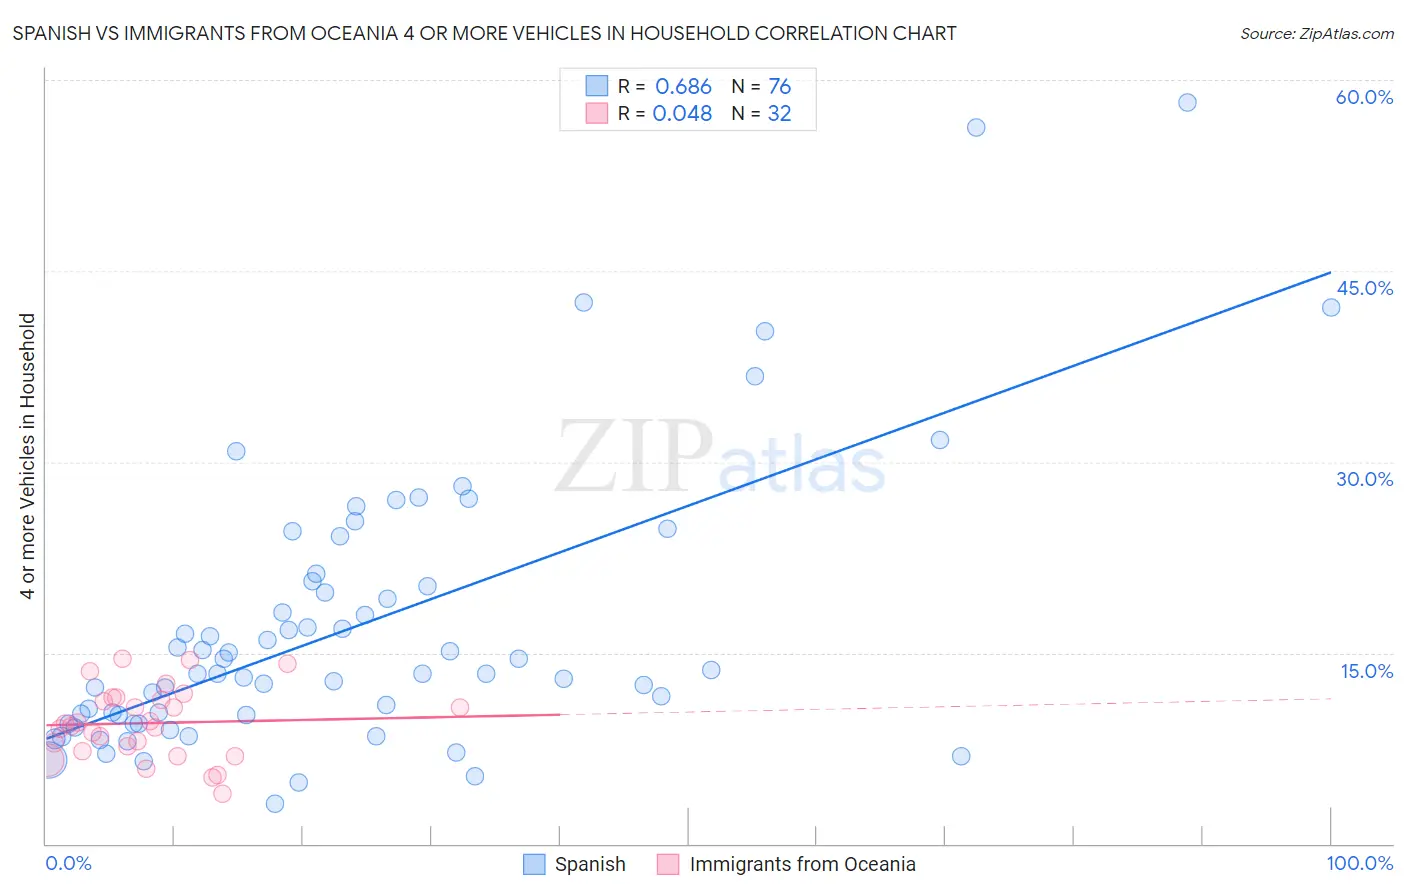
Spanish vs Immigrants from Oceania 4 or more Vehicles in Household Correlation Chart
The statistical analysis conducted on geographies consisting of 420,497,284 people shows a significant positive correlation between the proportion of Spanish and percentage of households with 4 or more vehicles available in the United States with a correlation coefficient (R) of 0.686 and weighted average of 7.9%. Similarly, the statistical analysis conducted on geographies consisting of 304,187,548 people shows no correlation between the proportion of Immigrants from Oceania and percentage of households with 4 or more vehicles available in the United States with a correlation coefficient (R) of 0.048 and weighted average of 7.6%, a difference of 3.7%.
4 or more Vehicles in Household Correlation Summary
| Measurement | Spanish | Immigrants from Oceania |
| Minimum | 3.2% | 3.9% |
| Maximum | 58.2% | 14.5% |
| Range | 55.0% | 10.6% |
| Mean | 17.0% | 9.5% |
| Median | 13.4% | 9.3% |
| Interquartile 25% (IQ1) | 9.8% | 7.5% |
| Interquartile 75% (IQ3) | 20.4% | 11.3% |
| Interquartile Range (IQR) | 10.7% | 3.9% |
| Standard Deviation (Sample) | 11.0% | 2.8% |
| Standard Deviation (Population) | 10.9% | 2.7% |
Demographics Similar to Spanish and Immigrants from Oceania by 4 or more Vehicles in Household
In terms of 4 or more vehicles in household, the demographic groups most similar to Spanish are Pima (7.9%, a difference of 0.57%), Spanish American (8.0%, a difference of 0.63%), Sioux (8.0%, a difference of 0.86%), Scandinavian (8.0%, a difference of 0.89%), and Salvadoran (7.8%, a difference of 1.1%). Similarly, the demographic groups most similar to Immigrants from Oceania are English (7.6%, a difference of 0.010%), Pennsylvania German (7.6%, a difference of 0.14%), Dutch (7.7%, a difference of 0.39%), Malaysian (7.7%, a difference of 0.47%), and Japanese (7.7%, a difference of 0.85%).
| Demographics | Rating | Rank | 4 or more Vehicles in Household |
| Scandinavians | 100.0 /100 | #37 | Exceptional 8.0% |
| Sioux | 100.0 /100 | #38 | Exceptional 8.0% |
| Spanish Americans | 100.0 /100 | #39 | Exceptional 8.0% |
| Spanish | 100.0 /100 | #40 | Exceptional 7.9% |
| Pima | 100.0 /100 | #41 | Exceptional 7.9% |
| Salvadorans | 100.0 /100 | #42 | Exceptional 7.8% |
| Fijians | 100.0 /100 | #43 | Exceptional 7.8% |
| Bhutanese | 100.0 /100 | #44 | Exceptional 7.8% |
| Choctaw | 100.0 /100 | #45 | Exceptional 7.8% |
| Crow | 100.0 /100 | #46 | Exceptional 7.8% |
| Osage | 100.0 /100 | #47 | Exceptional 7.8% |
| Swiss | 100.0 /100 | #48 | Exceptional 7.8% |
| Cherokee | 100.0 /100 | #49 | Exceptional 7.7% |
| Immigrants | El Salvador | 100.0 /100 | #50 | Exceptional 7.7% |
| Immigrants | Laos | 100.0 /100 | #51 | Exceptional 7.7% |
| Japanese | 100.0 /100 | #52 | Exceptional 7.7% |
| Malaysians | 100.0 /100 | #53 | Exceptional 7.7% |
| Dutch | 100.0 /100 | #54 | Exceptional 7.7% |
| Immigrants | Oceania | 100.0 /100 | #55 | Exceptional 7.6% |
| English | 100.0 /100 | #56 | Exceptional 7.6% |
| Pennsylvania Germans | 100.0 /100 | #57 | Exceptional 7.6% |