Spanish vs Immigrants from Senegal In Labor Force | Age 35-44
COMPARE
Spanish
Immigrants from Senegal
In Labor Force | Age 35-44
In Labor Force | Age 35-44 Comparison
Spanish
Immigrants from Senegal
83.2%
IN LABOR FORCE | AGE 35-44
0.0/ 100
METRIC RATING
273rd/ 347
METRIC RANK
84.4%
IN LABOR FORCE | AGE 35-44
60.4/ 100
METRIC RATING
159th/ 347
METRIC RANK
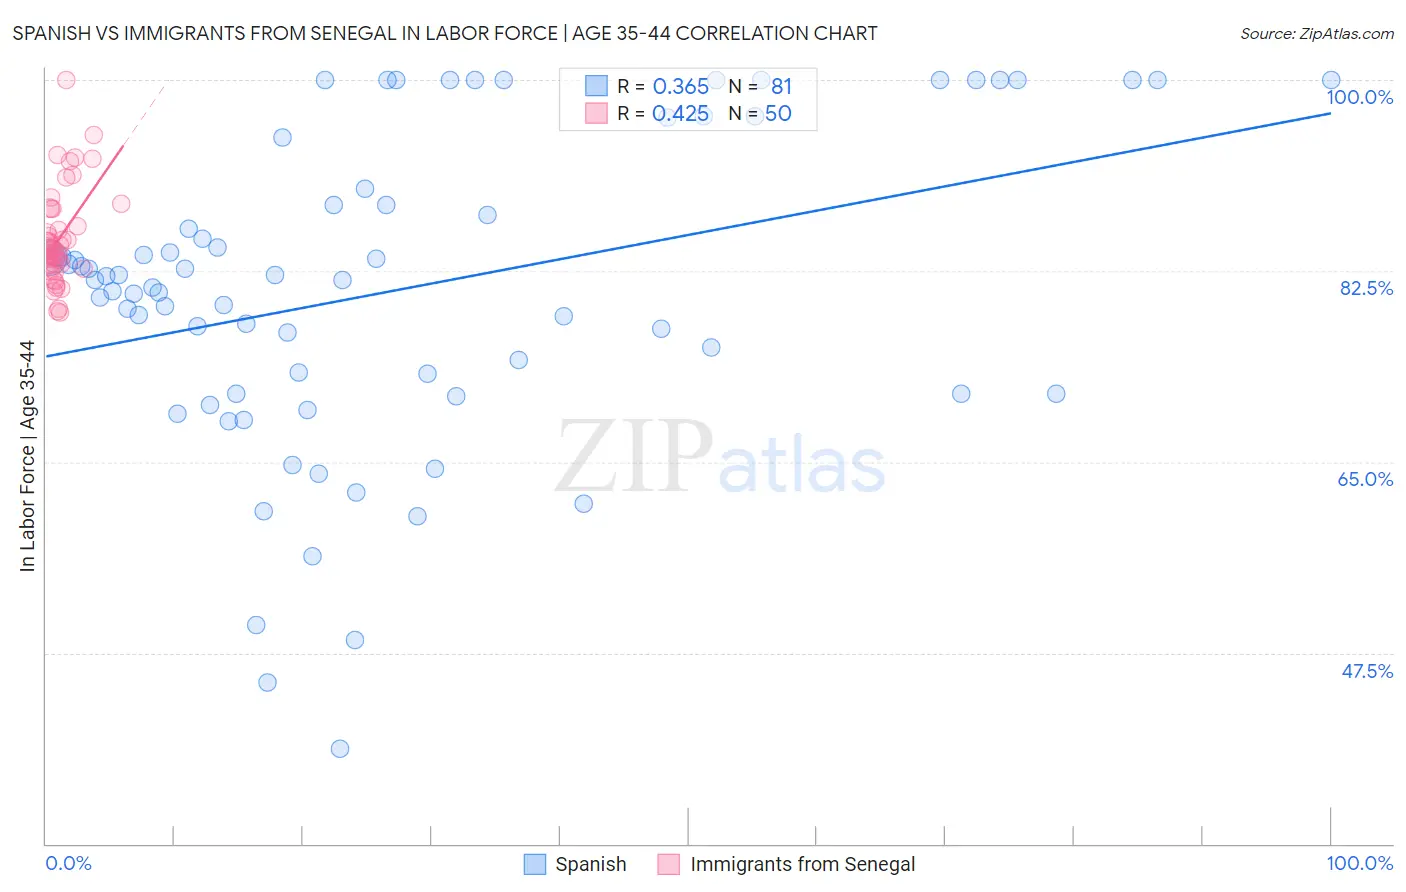
Spanish vs Immigrants from Senegal In Labor Force | Age 35-44 Correlation Chart
The statistical analysis conducted on geographies consisting of 421,966,219 people shows a mild positive correlation between the proportion of Spanish and labor force participation rate among population between the ages 35 and 44 in the United States with a correlation coefficient (R) of 0.365 and weighted average of 83.2%. Similarly, the statistical analysis conducted on geographies consisting of 90,121,198 people shows a moderate positive correlation between the proportion of Immigrants from Senegal and labor force participation rate among population between the ages 35 and 44 in the United States with a correlation coefficient (R) of 0.425 and weighted average of 84.4%, a difference of 1.4%.
In Labor Force | Age 35-44 Correlation Summary
| Measurement | Spanish | Immigrants from Senegal |
| Minimum | 38.7% | 78.7% |
| Maximum | 100.0% | 100.0% |
| Range | 61.3% | 21.3% |
| Mean | 80.7% | 85.5% |
| Median | 81.7% | 84.5% |
| Interquartile 25% (IQ1) | 71.3% | 83.1% |
| Interquartile 75% (IQ3) | 89.3% | 88.2% |
| Interquartile Range (IQR) | 18.0% | 5.1% |
| Standard Deviation (Sample) | 14.2% | 4.4% |
| Standard Deviation (Population) | 14.1% | 4.4% |
Similar Demographics by In Labor Force | Age 35-44
Demographics Similar to Spanish by In Labor Force | Age 35-44
In terms of in labor force | age 35-44, the demographic groups most similar to Spanish are Immigrants from Fiji (83.2%, a difference of 0.0%), Immigrants from Honduras (83.3%, a difference of 0.020%), French American Indian (83.2%, a difference of 0.020%), Nonimmigrants (83.2%, a difference of 0.020%), and Hawaiian (83.2%, a difference of 0.030%).
| Demographics | Rating | Rank | In Labor Force | Age 35-44 |
| Spaniards | 0.1 /100 | #266 | Tragic 83.4% |
| Guamanians/Chamorros | 0.1 /100 | #267 | Tragic 83.4% |
| Hondurans | 0.1 /100 | #268 | Tragic 83.4% |
| Immigrants | Grenada | 0.1 /100 | #269 | Tragic 83.3% |
| Immigrants | Honduras | 0.0 /100 | #270 | Tragic 83.3% |
| French American Indians | 0.0 /100 | #271 | Tragic 83.2% |
| Immigrants | Fiji | 0.0 /100 | #272 | Tragic 83.2% |
| Spanish | 0.0 /100 | #273 | Tragic 83.2% |
| Immigrants | Nonimmigrants | 0.0 /100 | #274 | Tragic 83.2% |
| Hawaiians | 0.0 /100 | #275 | Tragic 83.2% |
| Delaware | 0.0 /100 | #276 | Tragic 83.2% |
| Samoans | 0.0 /100 | #277 | Tragic 83.2% |
| Belizeans | 0.0 /100 | #278 | Tragic 83.1% |
| Immigrants | Micronesia | 0.0 /100 | #279 | Tragic 83.1% |
| Dominicans | 0.0 /100 | #280 | Tragic 83.1% |
Demographics Similar to Immigrants from Senegal by In Labor Force | Age 35-44
In terms of in labor force | age 35-44, the demographic groups most similar to Immigrants from Senegal are Immigrants from Kazakhstan (84.4%, a difference of 0.0%), Immigrants from Venezuela (84.4%, a difference of 0.0%), Immigrants from Hungary (84.4%, a difference of 0.010%), Aleut (84.4%, a difference of 0.010%), and Nigerian (84.4%, a difference of 0.010%).
| Demographics | Rating | Rank | In Labor Force | Age 35-44 |
| Immigrants | Taiwan | 71.4 /100 | #152 | Good 84.5% |
| Trinidadians and Tobagonians | 69.5 /100 | #153 | Good 84.5% |
| Iranians | 69.4 /100 | #154 | Good 84.5% |
| Immigrants | Switzerland | 65.9 /100 | #155 | Good 84.5% |
| Immigrants | Israel | 64.3 /100 | #156 | Good 84.4% |
| Immigrants | Austria | 63.8 /100 | #157 | Good 84.4% |
| Jamaicans | 62.7 /100 | #158 | Good 84.4% |
| Immigrants | Senegal | 60.4 /100 | #159 | Good 84.4% |
| Immigrants | Kazakhstan | 60.4 /100 | #160 | Good 84.4% |
| Immigrants | Venezuela | 60.0 /100 | #161 | Good 84.4% |
| Immigrants | Hungary | 59.4 /100 | #162 | Average 84.4% |
| Aleuts | 59.1 /100 | #163 | Average 84.4% |
| Nigerians | 58.9 /100 | #164 | Average 84.4% |
| Venezuelans | 58.1 /100 | #165 | Average 84.4% |
| Alsatians | 55.2 /100 | #166 | Average 84.4% |