Spanish vs Fijian In Labor Force | Age 20-24
COMPARE
Spanish
Fijian
In Labor Force | Age 20-24
In Labor Force | Age 20-24 Comparison
Spanish
Fijians
76.4%
IN LABOR FORCE | AGE 20-24
99.2/ 100
METRIC RATING
88th/ 347
METRIC RANK
77.4%
IN LABOR FORCE | AGE 20-24
100.0/ 100
METRIC RATING
44th/ 347
METRIC RANK
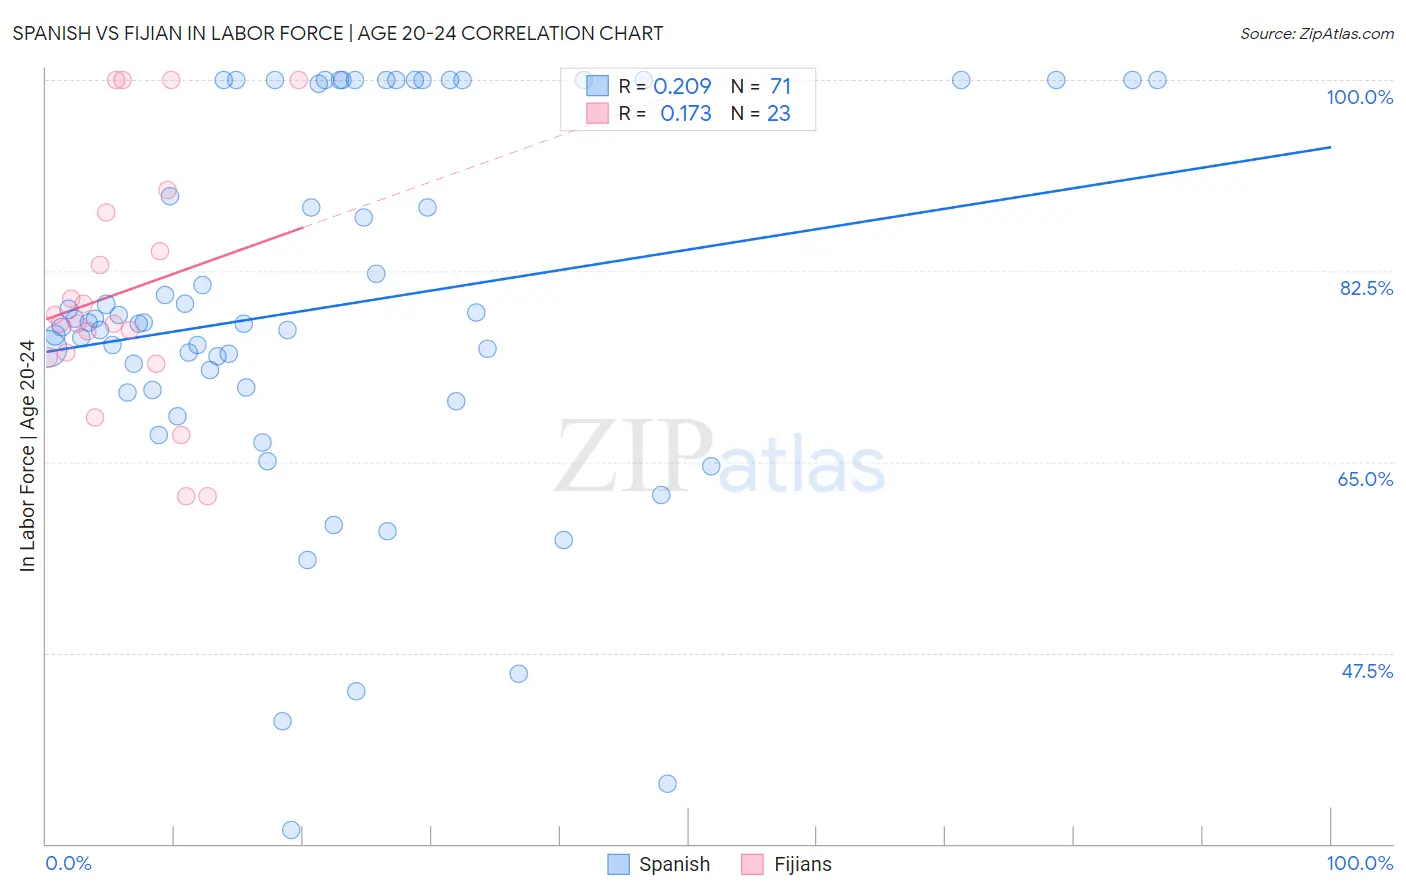
Spanish vs Fijian In Labor Force | Age 20-24 Correlation Chart
The statistical analysis conducted on geographies consisting of 421,912,033 people shows a weak positive correlation between the proportion of Spanish and labor force participation rate among population between the ages 20 and 24 in the United States with a correlation coefficient (R) of 0.209 and weighted average of 76.4%. Similarly, the statistical analysis conducted on geographies consisting of 55,946,131 people shows a poor positive correlation between the proportion of Fijians and labor force participation rate among population between the ages 20 and 24 in the United States with a correlation coefficient (R) of 0.173 and weighted average of 77.4%, a difference of 1.3%.
In Labor Force | Age 20-24 Correlation Summary
| Measurement | Spanish | Fijian |
| Minimum | 31.3% | 61.9% |
| Maximum | 100.0% | 100.0% |
| Range | 68.7% | 38.1% |
| Mean | 79.3% | 80.6% |
| Median | 77.8% | 77.7% |
| Interquartile 25% (IQ1) | 71.6% | 74.6% |
| Interquartile 75% (IQ3) | 100.0% | 87.9% |
| Interquartile Range (IQR) | 28.4% | 13.3% |
| Standard Deviation (Sample) | 17.1% | 11.4% |
| Standard Deviation (Population) | 16.9% | 11.1% |
Similar Demographics by In Labor Force | Age 20-24
Demographics Similar to Spanish by In Labor Force | Age 20-24
In terms of in labor force | age 20-24, the demographic groups most similar to Spanish are Bulgarian (76.4%, a difference of 0.010%), Immigrants from Iraq (76.4%, a difference of 0.050%), Immigrants from Thailand (76.4%, a difference of 0.050%), Immigrants from Burma/Myanmar (76.3%, a difference of 0.050%), and Portuguese (76.4%, a difference of 0.070%).
| Demographics | Rating | Rank | In Labor Force | Age 20-24 |
| Basques | 99.5 /100 | #81 | Exceptional 76.5% |
| Hmong | 99.5 /100 | #82 | Exceptional 76.5% |
| Carpatho Rusyns | 99.4 /100 | #83 | Exceptional 76.5% |
| Austrians | 99.4 /100 | #84 | Exceptional 76.5% |
| Portuguese | 99.3 /100 | #85 | Exceptional 76.4% |
| Immigrants | Iraq | 99.3 /100 | #86 | Exceptional 76.4% |
| Immigrants | Thailand | 99.3 /100 | #87 | Exceptional 76.4% |
| Spanish | 99.2 /100 | #88 | Exceptional 76.4% |
| Bulgarians | 99.2 /100 | #89 | Exceptional 76.4% |
| Immigrants | Burma/Myanmar | 99.1 /100 | #90 | Exceptional 76.3% |
| Sierra Leoneans | 99.0 /100 | #91 | Exceptional 76.3% |
| Maltese | 98.9 /100 | #92 | Exceptional 76.3% |
| Hungarians | 98.9 /100 | #93 | Exceptional 76.3% |
| Potawatomi | 98.5 /100 | #94 | Exceptional 76.2% |
| Immigrants | Germany | 98.5 /100 | #95 | Exceptional 76.2% |
Demographics Similar to Fijians by In Labor Force | Age 20-24
In terms of in labor force | age 20-24, the demographic groups most similar to Fijians are Immigrants from Laos (77.4%, a difference of 0.010%), Native Hawaiian (77.4%, a difference of 0.010%), Samoan (77.4%, a difference of 0.010%), French (77.4%, a difference of 0.020%), and Immigrants from Congo (77.4%, a difference of 0.030%).
| Demographics | Rating | Rank | In Labor Force | Age 20-24 |
| Czechoslovakians | 100.0 /100 | #37 | Exceptional 77.5% |
| Marshallese | 100.0 /100 | #38 | Exceptional 77.4% |
| Irish | 100.0 /100 | #39 | Exceptional 77.4% |
| Scottish | 100.0 /100 | #40 | Exceptional 77.4% |
| Immigrants | Congo | 100.0 /100 | #41 | Exceptional 77.4% |
| French | 100.0 /100 | #42 | Exceptional 77.4% |
| Immigrants | Laos | 100.0 /100 | #43 | Exceptional 77.4% |
| Fijians | 100.0 /100 | #44 | Exceptional 77.4% |
| Native Hawaiians | 100.0 /100 | #45 | Exceptional 77.4% |
| Samoans | 100.0 /100 | #46 | Exceptional 77.4% |
| Ethiopians | 100.0 /100 | #47 | Exceptional 77.3% |
| Serbians | 100.0 /100 | #48 | Exceptional 77.3% |
| Chinese | 100.0 /100 | #49 | Exceptional 77.3% |
| Malaysians | 100.0 /100 | #50 | Exceptional 77.2% |
| Croatians | 100.0 /100 | #51 | Exceptional 77.2% |