Pennsylvania German vs Fijian In Labor Force | Age 20-24
COMPARE
Pennsylvania German
Fijian
In Labor Force | Age 20-24
In Labor Force | Age 20-24 Comparison
Pennsylvania Germans
Fijians
78.0%
IN LABOR FORCE | AGE 20-24
100.0/ 100
METRIC RATING
22nd/ 347
METRIC RANK
77.4%
IN LABOR FORCE | AGE 20-24
100.0/ 100
METRIC RATING
44th/ 347
METRIC RANK
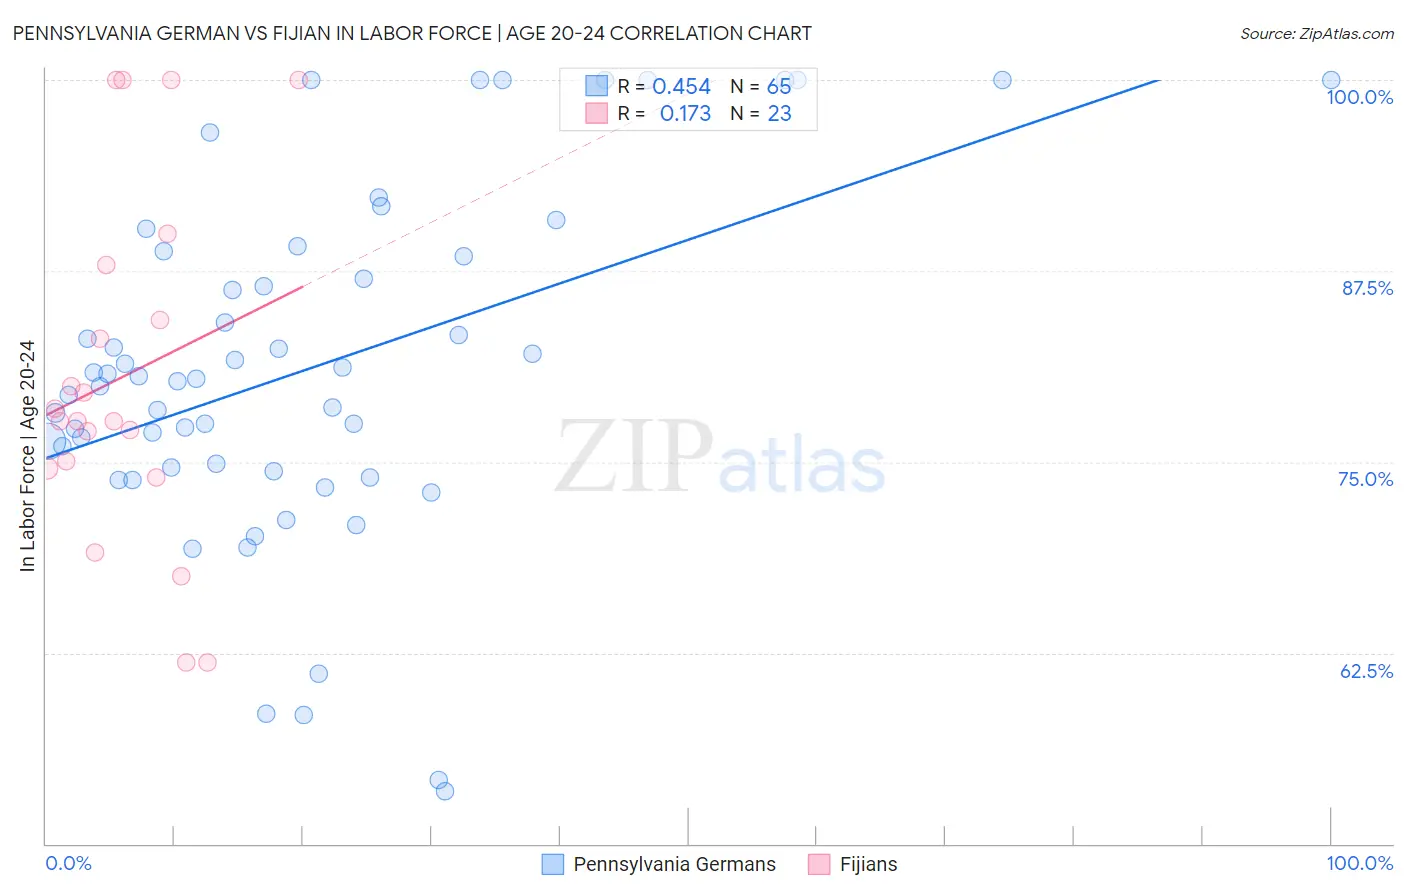
Pennsylvania German vs Fijian In Labor Force | Age 20-24 Correlation Chart
The statistical analysis conducted on geographies consisting of 233,933,296 people shows a moderate positive correlation between the proportion of Pennsylvania Germans and labor force participation rate among population between the ages 20 and 24 in the United States with a correlation coefficient (R) of 0.454 and weighted average of 78.0%. Similarly, the statistical analysis conducted on geographies consisting of 55,946,131 people shows a poor positive correlation between the proportion of Fijians and labor force participation rate among population between the ages 20 and 24 in the United States with a correlation coefficient (R) of 0.173 and weighted average of 77.4%, a difference of 0.78%.
In Labor Force | Age 20-24 Correlation Summary
| Measurement | Pennsylvania German | Fijian |
| Minimum | 53.4% | 61.9% |
| Maximum | 100.0% | 100.0% |
| Range | 46.6% | 38.1% |
| Mean | 81.1% | 80.6% |
| Median | 80.4% | 77.7% |
| Interquartile 25% (IQ1) | 74.5% | 74.6% |
| Interquartile 75% (IQ3) | 88.6% | 87.9% |
| Interquartile Range (IQR) | 14.1% | 13.3% |
| Standard Deviation (Sample) | 11.4% | 11.4% |
| Standard Deviation (Population) | 11.3% | 11.1% |
Similar Demographics by In Labor Force | Age 20-24
Demographics Similar to Pennsylvania Germans by In Labor Force | Age 20-24
In terms of in labor force | age 20-24, the demographic groups most similar to Pennsylvania Germans are Yugoslavian (78.0%, a difference of 0.010%), Liberian (78.0%, a difference of 0.010%), Tlingit-Haida (77.9%, a difference of 0.050%), Puget Sound Salish (78.0%, a difference of 0.060%), and Tongan (77.9%, a difference of 0.070%).
| Demographics | Rating | Rank | In Labor Force | Age 20-24 |
| Sudanese | 100.0 /100 | #15 | Exceptional 78.4% |
| Dutch | 100.0 /100 | #16 | Exceptional 78.4% |
| Cape Verdeans | 100.0 /100 | #17 | Exceptional 78.3% |
| Immigrants | Bosnia and Herzegovina | 100.0 /100 | #18 | Exceptional 78.1% |
| Bangladeshis | 100.0 /100 | #19 | Exceptional 78.1% |
| French Canadians | 100.0 /100 | #20 | Exceptional 78.1% |
| Puget Sound Salish | 100.0 /100 | #21 | Exceptional 78.0% |
| Pennsylvania Germans | 100.0 /100 | #22 | Exceptional 78.0% |
| Yugoslavians | 100.0 /100 | #23 | Exceptional 78.0% |
| Liberians | 100.0 /100 | #24 | Exceptional 78.0% |
| Tlingit-Haida | 100.0 /100 | #25 | Exceptional 77.9% |
| Tongans | 100.0 /100 | #26 | Exceptional 77.9% |
| Immigrants | Micronesia | 100.0 /100 | #27 | Exceptional 77.8% |
| Belgians | 100.0 /100 | #28 | Exceptional 77.8% |
| Slovaks | 100.0 /100 | #29 | Exceptional 77.7% |
Demographics Similar to Fijians by In Labor Force | Age 20-24
In terms of in labor force | age 20-24, the demographic groups most similar to Fijians are Immigrants from Laos (77.4%, a difference of 0.010%), Native Hawaiian (77.4%, a difference of 0.010%), Samoan (77.4%, a difference of 0.010%), French (77.4%, a difference of 0.020%), and Immigrants from Congo (77.4%, a difference of 0.030%).
| Demographics | Rating | Rank | In Labor Force | Age 20-24 |
| Czechoslovakians | 100.0 /100 | #37 | Exceptional 77.5% |
| Marshallese | 100.0 /100 | #38 | Exceptional 77.4% |
| Irish | 100.0 /100 | #39 | Exceptional 77.4% |
| Scottish | 100.0 /100 | #40 | Exceptional 77.4% |
| Immigrants | Congo | 100.0 /100 | #41 | Exceptional 77.4% |
| French | 100.0 /100 | #42 | Exceptional 77.4% |
| Immigrants | Laos | 100.0 /100 | #43 | Exceptional 77.4% |
| Fijians | 100.0 /100 | #44 | Exceptional 77.4% |
| Native Hawaiians | 100.0 /100 | #45 | Exceptional 77.4% |
| Samoans | 100.0 /100 | #46 | Exceptional 77.4% |
| Ethiopians | 100.0 /100 | #47 | Exceptional 77.3% |
| Serbians | 100.0 /100 | #48 | Exceptional 77.3% |
| Chinese | 100.0 /100 | #49 | Exceptional 77.3% |
| Malaysians | 100.0 /100 | #50 | Exceptional 77.2% |
| Croatians | 100.0 /100 | #51 | Exceptional 77.2% |