Spanish vs Fijian Single Father Poverty
COMPARE
Spanish
Fijian
Single Father Poverty
Single Father Poverty Comparison
Spanish
Fijians
16.7%
SINGLE FATHER POVERTY
10.7/ 100
METRIC RATING
214th/ 347
METRIC RANK
15.7%
SINGLE FATHER POVERTY
96.8/ 100
METRIC RATING
101st/ 347
METRIC RANK
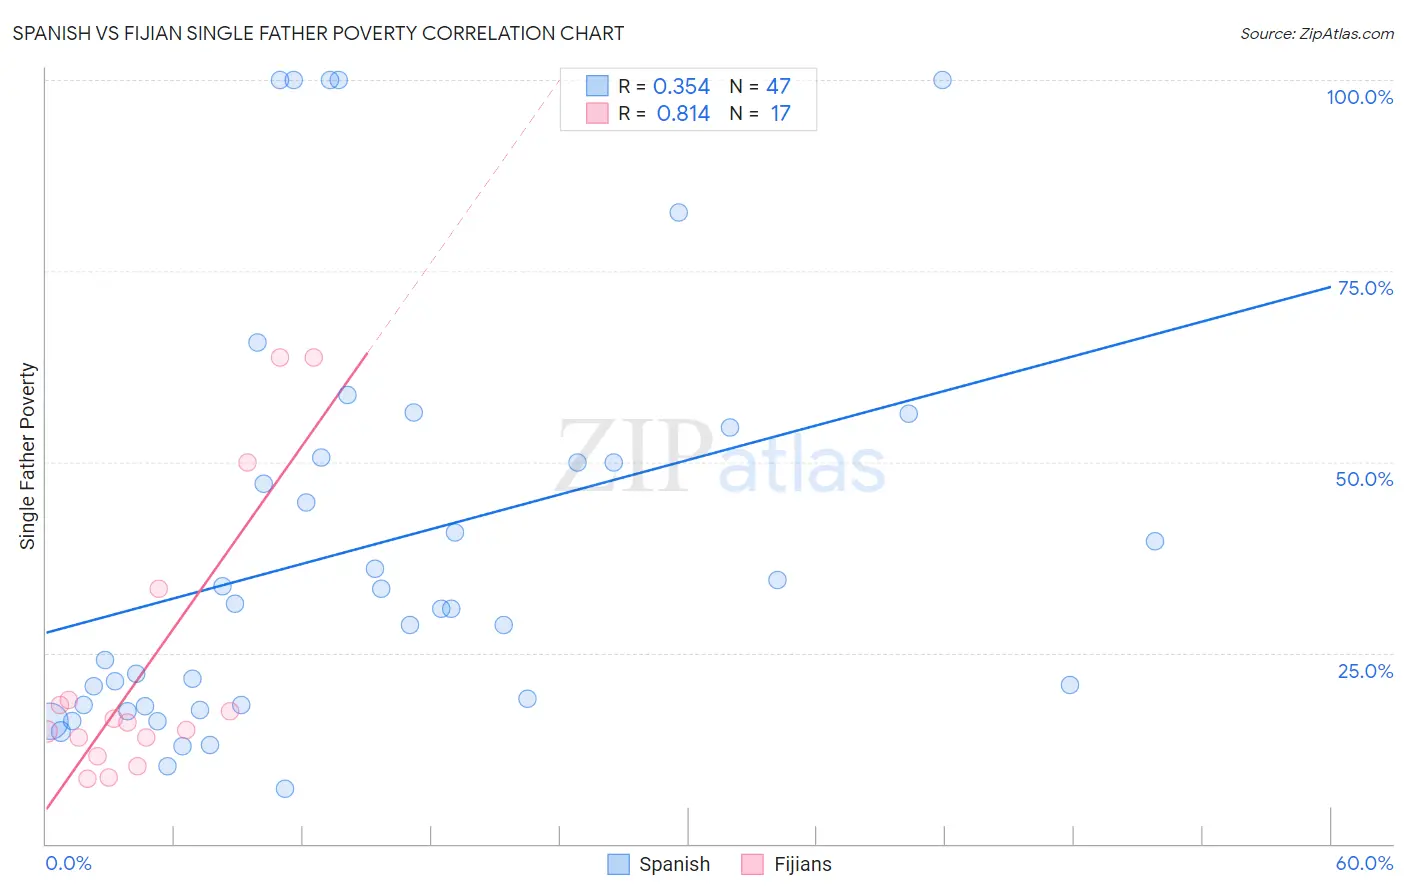
Spanish vs Fijian Single Father Poverty Correlation Chart
The statistical analysis conducted on geographies consisting of 330,244,668 people shows a mild positive correlation between the proportion of Spanish and poverty level among single fathers in the United States with a correlation coefficient (R) of 0.354 and weighted average of 16.7%. Similarly, the statistical analysis conducted on geographies consisting of 52,243,042 people shows a very strong positive correlation between the proportion of Fijians and poverty level among single fathers in the United States with a correlation coefficient (R) of 0.814 and weighted average of 15.7%, a difference of 6.4%.
Single Father Poverty Correlation Summary
| Measurement | Spanish | Fijian |
| Minimum | 7.2% | 8.5% |
| Maximum | 100.0% | 63.6% |
| Range | 92.8% | 55.2% |
| Mean | 38.9% | 23.1% |
| Median | 30.8% | 15.9% |
| Interquartile 25% (IQ1) | 18.1% | 12.7% |
| Interquartile 75% (IQ3) | 50.5% | 26.1% |
| Interquartile Range (IQR) | 32.4% | 13.4% |
| Standard Deviation (Sample) | 26.9% | 18.2% |
| Standard Deviation (Population) | 26.6% | 17.7% |
Similar Demographics by Single Father Poverty
Demographics Similar to Spanish by Single Father Poverty
In terms of single father poverty, the demographic groups most similar to Spanish are Ghanaian (16.7%, a difference of 0.040%), Immigrants from Southern Europe (16.7%, a difference of 0.050%), Immigrants from Scotland (16.7%, a difference of 0.13%), Immigrants from England (16.7%, a difference of 0.14%), and Cheyenne (16.7%, a difference of 0.17%).
| Demographics | Rating | Rank | Single Father Poverty |
| New Zealanders | 13.7 /100 | #207 | Poor 16.6% |
| Eastern Europeans | 13.7 /100 | #208 | Poor 16.6% |
| Europeans | 13.2 /100 | #209 | Poor 16.6% |
| Guatemalans | 12.9 /100 | #210 | Poor 16.6% |
| Arabs | 12.8 /100 | #211 | Poor 16.6% |
| Immigrants | Southern Europe | 11.2 /100 | #212 | Poor 16.7% |
| Ghanaians | 11.0 /100 | #213 | Poor 16.7% |
| Spanish | 10.7 /100 | #214 | Poor 16.7% |
| Immigrants | Scotland | 9.6 /100 | #215 | Tragic 16.7% |
| Immigrants | England | 9.5 /100 | #216 | Tragic 16.7% |
| Cheyenne | 9.3 /100 | #217 | Tragic 16.7% |
| Immigrants | Uganda | 8.6 /100 | #218 | Tragic 16.7% |
| Immigrants | Ghana | 8.1 /100 | #219 | Tragic 16.7% |
| Immigrants | Denmark | 8.1 /100 | #220 | Tragic 16.7% |
| Immigrants | Greece | 8.1 /100 | #221 | Tragic 16.7% |
Demographics Similar to Fijians by Single Father Poverty
In terms of single father poverty, the demographic groups most similar to Fijians are Immigrants from Chile (15.7%, a difference of 0.030%), Chilean (15.7%, a difference of 0.16%), South American Indian (15.7%, a difference of 0.22%), Australian (15.7%, a difference of 0.24%), and Immigrants from Middle Africa (15.6%, a difference of 0.25%).
| Demographics | Rating | Rank | Single Father Poverty |
| Immigrants | Uruguay | 98.2 /100 | #94 | Exceptional 15.6% |
| Immigrants | Kazakhstan | 98.2 /100 | #95 | Exceptional 15.6% |
| Immigrants | Belgium | 98.1 /100 | #96 | Exceptional 15.6% |
| Yaqui | 98.1 /100 | #97 | Exceptional 15.6% |
| Zimbabweans | 98.1 /100 | #98 | Exceptional 15.6% |
| Immigrants | Middle Africa | 97.4 /100 | #99 | Exceptional 15.6% |
| Immigrants | Chile | 96.9 /100 | #100 | Exceptional 15.7% |
| Fijians | 96.8 /100 | #101 | Exceptional 15.7% |
| Chileans | 96.4 /100 | #102 | Exceptional 15.7% |
| South American Indians | 96.2 /100 | #103 | Exceptional 15.7% |
| Australians | 96.1 /100 | #104 | Exceptional 15.7% |
| Immigrants | Australia | 96.1 /100 | #105 | Exceptional 15.7% |
| Immigrants | Poland | 95.8 /100 | #106 | Exceptional 15.7% |
| Native Hawaiians | 95.8 /100 | #107 | Exceptional 15.7% |
| Pakistanis | 95.7 /100 | #108 | Exceptional 15.7% |