Spanish vs Okinawan In Labor Force | Age 20-24
COMPARE
Spanish
Okinawan
In Labor Force | Age 20-24
In Labor Force | Age 20-24 Comparison
Spanish
Okinawans
76.4%
IN LABOR FORCE | AGE 20-24
99.2/ 100
METRIC RATING
88th/ 347
METRIC RANK
72.7%
IN LABOR FORCE | AGE 20-24
0.0/ 100
METRIC RATING
295th/ 347
METRIC RANK
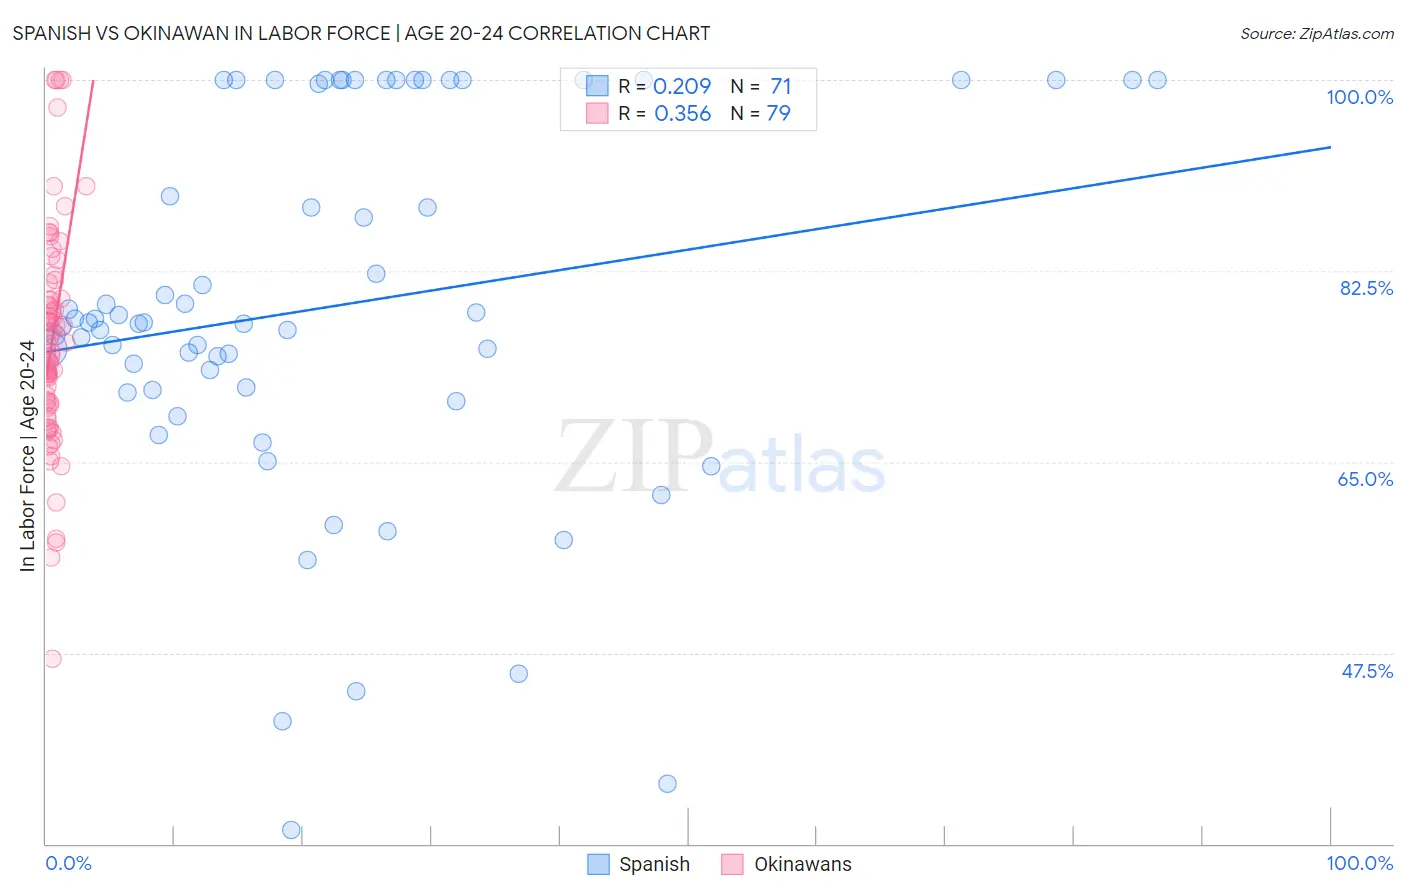
Spanish vs Okinawan In Labor Force | Age 20-24 Correlation Chart
The statistical analysis conducted on geographies consisting of 421,912,033 people shows a weak positive correlation between the proportion of Spanish and labor force participation rate among population between the ages 20 and 24 in the United States with a correlation coefficient (R) of 0.209 and weighted average of 76.4%. Similarly, the statistical analysis conducted on geographies consisting of 73,779,368 people shows a mild positive correlation between the proportion of Okinawans and labor force participation rate among population between the ages 20 and 24 in the United States with a correlation coefficient (R) of 0.356 and weighted average of 72.7%, a difference of 5.0%.
In Labor Force | Age 20-24 Correlation Summary
| Measurement | Spanish | Okinawan |
| Minimum | 31.3% | 46.9% |
| Maximum | 100.0% | 100.0% |
| Range | 68.7% | 53.1% |
| Mean | 79.3% | 76.0% |
| Median | 77.8% | 75.0% |
| Interquartile 25% (IQ1) | 71.6% | 70.2% |
| Interquartile 75% (IQ3) | 100.0% | 80.0% |
| Interquartile Range (IQR) | 28.4% | 9.8% |
| Standard Deviation (Sample) | 17.1% | 9.9% |
| Standard Deviation (Population) | 16.9% | 9.9% |
Similar Demographics by In Labor Force | Age 20-24
Demographics Similar to Spanish by In Labor Force | Age 20-24
In terms of in labor force | age 20-24, the demographic groups most similar to Spanish are Bulgarian (76.4%, a difference of 0.010%), Immigrants from Iraq (76.4%, a difference of 0.050%), Immigrants from Thailand (76.4%, a difference of 0.050%), Immigrants from Burma/Myanmar (76.3%, a difference of 0.050%), and Portuguese (76.4%, a difference of 0.070%).
| Demographics | Rating | Rank | In Labor Force | Age 20-24 |
| Basques | 99.5 /100 | #81 | Exceptional 76.5% |
| Hmong | 99.5 /100 | #82 | Exceptional 76.5% |
| Carpatho Rusyns | 99.4 /100 | #83 | Exceptional 76.5% |
| Austrians | 99.4 /100 | #84 | Exceptional 76.5% |
| Portuguese | 99.3 /100 | #85 | Exceptional 76.4% |
| Immigrants | Iraq | 99.3 /100 | #86 | Exceptional 76.4% |
| Immigrants | Thailand | 99.3 /100 | #87 | Exceptional 76.4% |
| Spanish | 99.2 /100 | #88 | Exceptional 76.4% |
| Bulgarians | 99.2 /100 | #89 | Exceptional 76.4% |
| Immigrants | Burma/Myanmar | 99.1 /100 | #90 | Exceptional 76.3% |
| Sierra Leoneans | 99.0 /100 | #91 | Exceptional 76.3% |
| Maltese | 98.9 /100 | #92 | Exceptional 76.3% |
| Hungarians | 98.9 /100 | #93 | Exceptional 76.3% |
| Potawatomi | 98.5 /100 | #94 | Exceptional 76.2% |
| Immigrants | Germany | 98.5 /100 | #95 | Exceptional 76.2% |
Demographics Similar to Okinawans by In Labor Force | Age 20-24
In terms of in labor force | age 20-24, the demographic groups most similar to Okinawans are Jamaican (72.7%, a difference of 0.0%), Central American Indian (72.7%, a difference of 0.050%), Immigrants from Argentina (72.8%, a difference of 0.11%), Immigrants from Belize (72.8%, a difference of 0.14%), and Israeli (72.6%, a difference of 0.18%).
| Demographics | Rating | Rank | In Labor Force | Age 20-24 |
| Argentineans | 0.1 /100 | #288 | Tragic 73.1% |
| U.S. Virgin Islanders | 0.1 /100 | #289 | Tragic 73.0% |
| Immigrants | Belarus | 0.1 /100 | #290 | Tragic 73.0% |
| Immigrants | Nicaragua | 0.0 /100 | #291 | Tragic 72.9% |
| Pueblo | 0.0 /100 | #292 | Tragic 72.9% |
| Immigrants | Belize | 0.0 /100 | #293 | Tragic 72.8% |
| Immigrants | Argentina | 0.0 /100 | #294 | Tragic 72.8% |
| Okinawans | 0.0 /100 | #295 | Tragic 72.7% |
| Jamaicans | 0.0 /100 | #296 | Tragic 72.7% |
| Central American Indians | 0.0 /100 | #297 | Tragic 72.7% |
| Israelis | 0.0 /100 | #298 | Tragic 72.6% |
| Iranians | 0.0 /100 | #299 | Tragic 72.6% |
| Armenians | 0.0 /100 | #300 | Tragic 72.5% |
| Cubans | 0.0 /100 | #301 | Tragic 72.5% |
| Natives/Alaskans | 0.0 /100 | #302 | Tragic 72.4% |