Spanish vs Immigrants from Iran In Labor Force | Age 20-24
COMPARE
Spanish
Immigrants from Iran
In Labor Force | Age 20-24
In Labor Force | Age 20-24 Comparison
Spanish
Immigrants from Iran
76.4%
IN LABOR FORCE | AGE 20-24
99.2/ 100
METRIC RATING
88th/ 347
METRIC RANK
71.8%
IN LABOR FORCE | AGE 20-24
0.0/ 100
METRIC RATING
315th/ 347
METRIC RANK
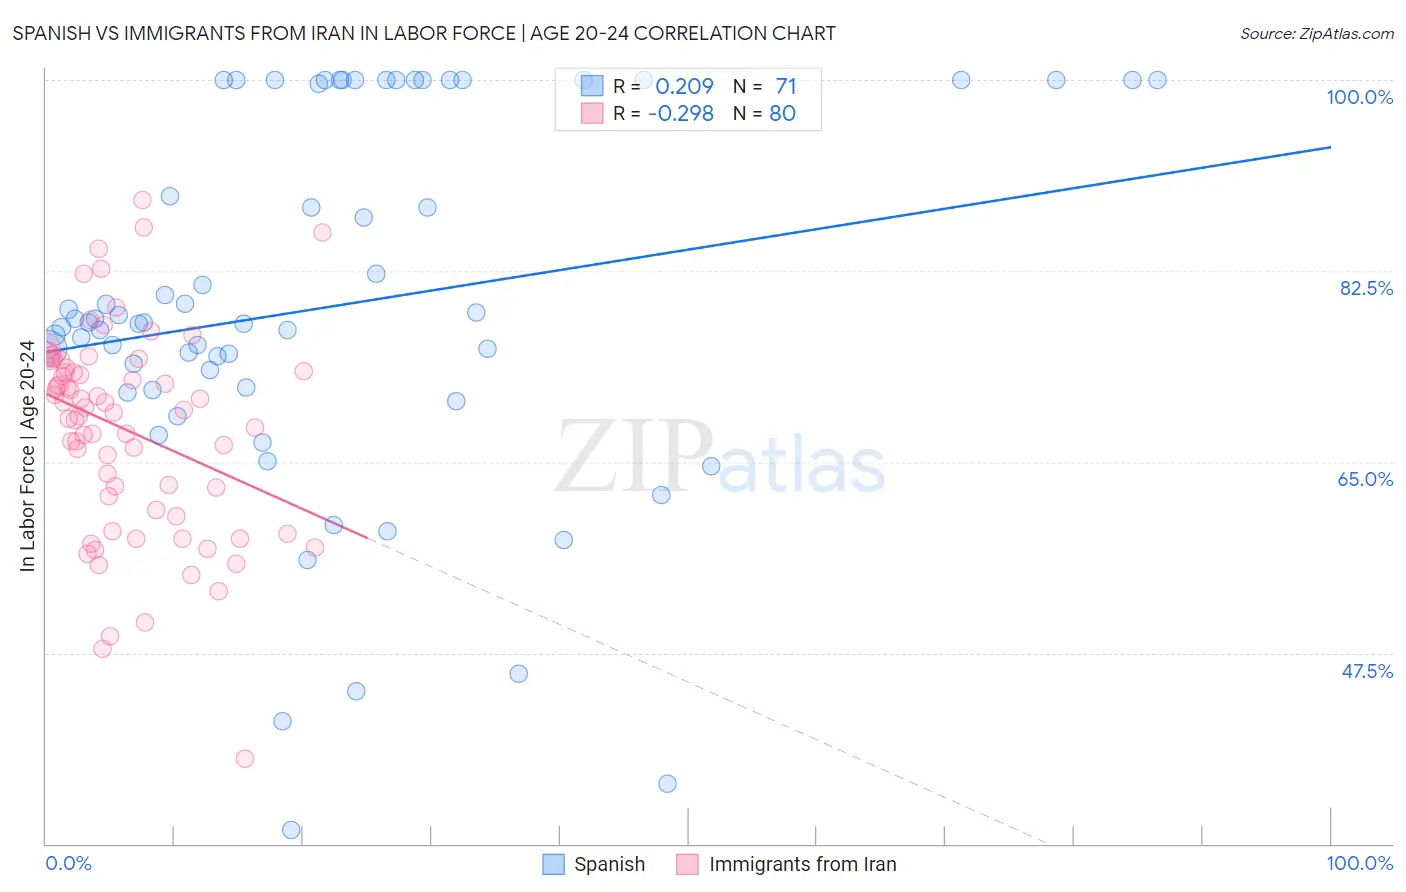
Spanish vs Immigrants from Iran In Labor Force | Age 20-24 Correlation Chart
The statistical analysis conducted on geographies consisting of 421,912,033 people shows a weak positive correlation between the proportion of Spanish and labor force participation rate among population between the ages 20 and 24 in the United States with a correlation coefficient (R) of 0.209 and weighted average of 76.4%. Similarly, the statistical analysis conducted on geographies consisting of 279,798,180 people shows a weak negative correlation between the proportion of Immigrants from Iran and labor force participation rate among population between the ages 20 and 24 in the United States with a correlation coefficient (R) of -0.298 and weighted average of 71.8%, a difference of 6.3%.
In Labor Force | Age 20-24 Correlation Summary
| Measurement | Spanish | Immigrants from Iran |
| Minimum | 31.3% | 37.8% |
| Maximum | 100.0% | 89.0% |
| Range | 68.7% | 51.2% |
| Mean | 79.3% | 68.0% |
| Median | 77.8% | 69.8% |
| Interquartile 25% (IQ1) | 71.6% | 61.2% |
| Interquartile 75% (IQ3) | 100.0% | 74.0% |
| Interquartile Range (IQR) | 28.4% | 12.8% |
| Standard Deviation (Sample) | 17.1% | 9.5% |
| Standard Deviation (Population) | 16.9% | 9.4% |
Similar Demographics by In Labor Force | Age 20-24
Demographics Similar to Spanish by In Labor Force | Age 20-24
In terms of in labor force | age 20-24, the demographic groups most similar to Spanish are Bulgarian (76.4%, a difference of 0.010%), Immigrants from Iraq (76.4%, a difference of 0.050%), Immigrants from Thailand (76.4%, a difference of 0.050%), Immigrants from Burma/Myanmar (76.3%, a difference of 0.050%), and Portuguese (76.4%, a difference of 0.070%).
| Demographics | Rating | Rank | In Labor Force | Age 20-24 |
| Basques | 99.5 /100 | #81 | Exceptional 76.5% |
| Hmong | 99.5 /100 | #82 | Exceptional 76.5% |
| Carpatho Rusyns | 99.4 /100 | #83 | Exceptional 76.5% |
| Austrians | 99.4 /100 | #84 | Exceptional 76.5% |
| Portuguese | 99.3 /100 | #85 | Exceptional 76.4% |
| Immigrants | Iraq | 99.3 /100 | #86 | Exceptional 76.4% |
| Immigrants | Thailand | 99.3 /100 | #87 | Exceptional 76.4% |
| Spanish | 99.2 /100 | #88 | Exceptional 76.4% |
| Bulgarians | 99.2 /100 | #89 | Exceptional 76.4% |
| Immigrants | Burma/Myanmar | 99.1 /100 | #90 | Exceptional 76.3% |
| Sierra Leoneans | 99.0 /100 | #91 | Exceptional 76.3% |
| Maltese | 98.9 /100 | #92 | Exceptional 76.3% |
| Hungarians | 98.9 /100 | #93 | Exceptional 76.3% |
| Potawatomi | 98.5 /100 | #94 | Exceptional 76.2% |
| Immigrants | Germany | 98.5 /100 | #95 | Exceptional 76.2% |
Demographics Similar to Immigrants from Iran by In Labor Force | Age 20-24
In terms of in labor force | age 20-24, the demographic groups most similar to Immigrants from Iran are Immigrants from Eastern Asia (71.8%, a difference of 0.040%), Immigrants from Dominica (71.9%, a difference of 0.090%), Indian (Asian) (71.9%, a difference of 0.090%), Immigrants from Caribbean (71.9%, a difference of 0.14%), and Immigrants from Armenia (71.7%, a difference of 0.21%).
| Demographics | Rating | Rank | In Labor Force | Age 20-24 |
| Soviet Union | 0.0 /100 | #308 | Tragic 72.3% |
| Tsimshian | 0.0 /100 | #309 | Tragic 72.3% |
| Immigrants | Cuba | 0.0 /100 | #310 | Tragic 72.0% |
| Apache | 0.0 /100 | #311 | Tragic 72.0% |
| Immigrants | Caribbean | 0.0 /100 | #312 | Tragic 71.9% |
| Immigrants | Dominica | 0.0 /100 | #313 | Tragic 71.9% |
| Indians (Asian) | 0.0 /100 | #314 | Tragic 71.9% |
| Immigrants | Iran | 0.0 /100 | #315 | Tragic 71.8% |
| Immigrants | Eastern Asia | 0.0 /100 | #316 | Tragic 71.8% |
| Immigrants | Armenia | 0.0 /100 | #317 | Tragic 71.7% |
| Immigrants | Hong Kong | 0.0 /100 | #318 | Tragic 71.6% |
| Immigrants | Israel | 0.0 /100 | #319 | Tragic 71.6% |
| Trinidadians and Tobagonians | 0.0 /100 | #320 | Tragic 71.5% |
| Immigrants | Taiwan | 0.0 /100 | #321 | Tragic 71.5% |
| Filipinos | 0.0 /100 | #322 | Tragic 71.4% |