Spanish vs Immigrants from Northern Africa In Labor Force | Age 20-24
COMPARE
Spanish
Immigrants from Northern Africa
In Labor Force | Age 20-24
In Labor Force | Age 20-24 Comparison
Spanish
Immigrants from Northern Africa
76.4%
IN LABOR FORCE | AGE 20-24
99.2/ 100
METRIC RATING
88th/ 347
METRIC RANK
74.6%
IN LABOR FORCE | AGE 20-24
17.9/ 100
METRIC RATING
203rd/ 347
METRIC RANK
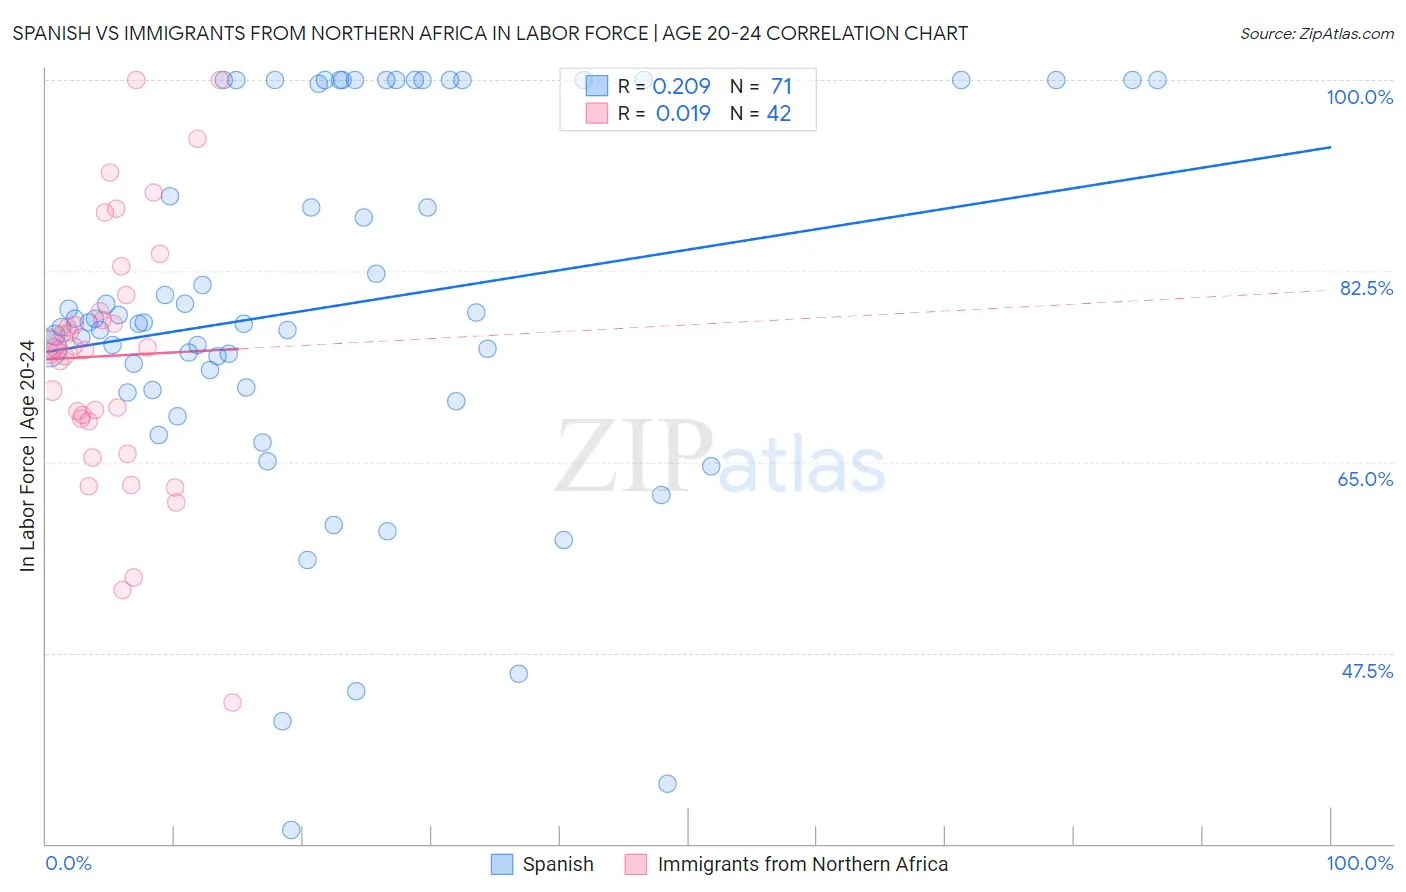
Spanish vs Immigrants from Northern Africa In Labor Force | Age 20-24 Correlation Chart
The statistical analysis conducted on geographies consisting of 421,912,033 people shows a weak positive correlation between the proportion of Spanish and labor force participation rate among population between the ages 20 and 24 in the United States with a correlation coefficient (R) of 0.209 and weighted average of 76.4%. Similarly, the statistical analysis conducted on geographies consisting of 321,123,138 people shows no correlation between the proportion of Immigrants from Northern Africa and labor force participation rate among population between the ages 20 and 24 in the United States with a correlation coefficient (R) of 0.019 and weighted average of 74.6%, a difference of 2.3%.
In Labor Force | Age 20-24 Correlation Summary
| Measurement | Spanish | Immigrants from Northern Africa |
| Minimum | 31.3% | 42.9% |
| Maximum | 100.0% | 100.0% |
| Range | 68.7% | 57.1% |
| Mean | 79.3% | 74.7% |
| Median | 77.8% | 75.4% |
| Interquartile 25% (IQ1) | 71.6% | 69.0% |
| Interquartile 75% (IQ3) | 100.0% | 78.8% |
| Interquartile Range (IQR) | 28.4% | 9.8% |
| Standard Deviation (Sample) | 17.1% | 11.7% |
| Standard Deviation (Population) | 16.9% | 11.6% |
Similar Demographics by In Labor Force | Age 20-24
Demographics Similar to Spanish by In Labor Force | Age 20-24
In terms of in labor force | age 20-24, the demographic groups most similar to Spanish are Bulgarian (76.4%, a difference of 0.010%), Immigrants from Iraq (76.4%, a difference of 0.050%), Immigrants from Thailand (76.4%, a difference of 0.050%), Immigrants from Burma/Myanmar (76.3%, a difference of 0.050%), and Portuguese (76.4%, a difference of 0.070%).
| Demographics | Rating | Rank | In Labor Force | Age 20-24 |
| Basques | 99.5 /100 | #81 | Exceptional 76.5% |
| Hmong | 99.5 /100 | #82 | Exceptional 76.5% |
| Carpatho Rusyns | 99.4 /100 | #83 | Exceptional 76.5% |
| Austrians | 99.4 /100 | #84 | Exceptional 76.5% |
| Portuguese | 99.3 /100 | #85 | Exceptional 76.4% |
| Immigrants | Iraq | 99.3 /100 | #86 | Exceptional 76.4% |
| Immigrants | Thailand | 99.3 /100 | #87 | Exceptional 76.4% |
| Spanish | 99.2 /100 | #88 | Exceptional 76.4% |
| Bulgarians | 99.2 /100 | #89 | Exceptional 76.4% |
| Immigrants | Burma/Myanmar | 99.1 /100 | #90 | Exceptional 76.3% |
| Sierra Leoneans | 99.0 /100 | #91 | Exceptional 76.3% |
| Maltese | 98.9 /100 | #92 | Exceptional 76.3% |
| Hungarians | 98.9 /100 | #93 | Exceptional 76.3% |
| Potawatomi | 98.5 /100 | #94 | Exceptional 76.2% |
| Immigrants | Germany | 98.5 /100 | #95 | Exceptional 76.2% |
Demographics Similar to Immigrants from Northern Africa by In Labor Force | Age 20-24
In terms of in labor force | age 20-24, the demographic groups most similar to Immigrants from Northern Africa are Immigrants from Italy (74.6%, a difference of 0.010%), Inupiat (74.6%, a difference of 0.010%), Sioux (74.6%, a difference of 0.010%), Albanian (74.6%, a difference of 0.040%), and Moroccan (74.7%, a difference of 0.060%).
| Demographics | Rating | Rank | In Labor Force | Age 20-24 |
| Immigrants | Vietnam | 25.1 /100 | #196 | Fair 74.7% |
| Panamanians | 25.0 /100 | #197 | Fair 74.7% |
| Immigrants | Nigeria | 24.2 /100 | #198 | Fair 74.7% |
| Taiwanese | 23.2 /100 | #199 | Fair 74.7% |
| Nigerians | 21.9 /100 | #200 | Fair 74.7% |
| Choctaw | 21.4 /100 | #201 | Fair 74.7% |
| Moroccans | 20.4 /100 | #202 | Fair 74.7% |
| Immigrants | Northern Africa | 17.9 /100 | #203 | Poor 74.6% |
| Immigrants | Italy | 17.6 /100 | #204 | Poor 74.6% |
| Inupiat | 17.6 /100 | #205 | Poor 74.6% |
| Sioux | 17.5 /100 | #206 | Poor 74.6% |
| Albanians | 16.2 /100 | #207 | Poor 74.6% |
| Immigrants | Uruguay | 15.8 /100 | #208 | Poor 74.6% |
| Arabs | 15.8 /100 | #209 | Poor 74.6% |
| Uruguayans | 15.1 /100 | #210 | Poor 74.6% |