Basque vs Carpatho Rusyn In Labor Force | Age 35-44
COMPARE
Basque
Carpatho Rusyn
In Labor Force | Age 35-44
In Labor Force | Age 35-44 Comparison
Basques
Carpatho Rusyns
83.6%
IN LABOR FORCE | AGE 35-44
0.3/ 100
METRIC RATING
257th/ 347
METRIC RANK
85.6%
IN LABOR FORCE | AGE 35-44
100.0/ 100
METRIC RATING
18th/ 347
METRIC RANK
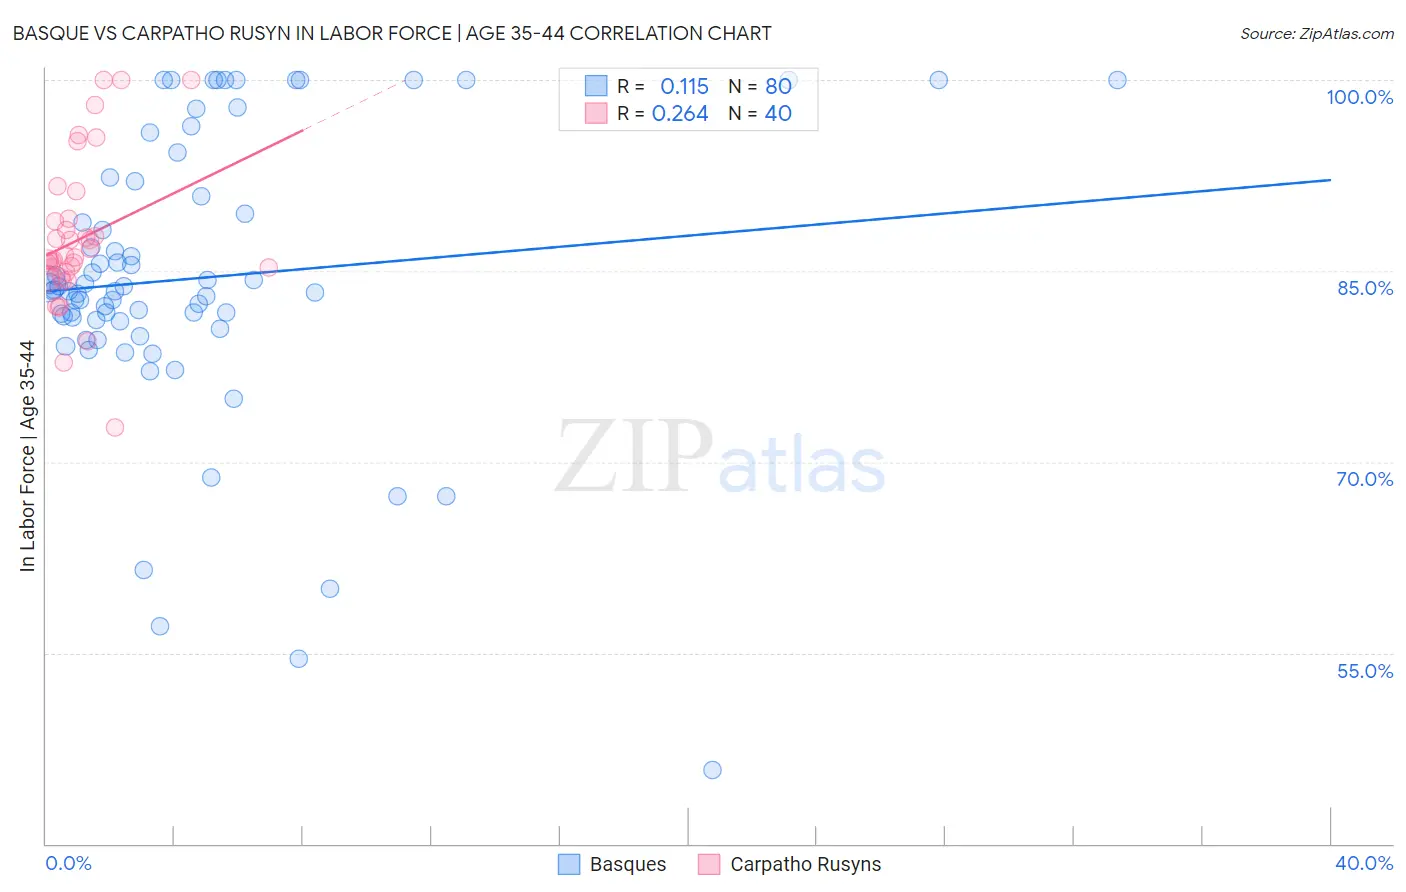
Basque vs Carpatho Rusyn In Labor Force | Age 35-44 Correlation Chart
The statistical analysis conducted on geographies consisting of 165,759,018 people shows a poor positive correlation between the proportion of Basques and labor force participation rate among population between the ages 35 and 44 in the United States with a correlation coefficient (R) of 0.115 and weighted average of 83.6%. Similarly, the statistical analysis conducted on geographies consisting of 58,868,211 people shows a weak positive correlation between the proportion of Carpatho Rusyns and labor force participation rate among population between the ages 35 and 44 in the United States with a correlation coefficient (R) of 0.264 and weighted average of 85.6%, a difference of 2.4%.
In Labor Force | Age 35-44 Correlation Summary
| Measurement | Basque | Carpatho Rusyn |
| Minimum | 45.8% | 72.7% |
| Maximum | 100.0% | 100.0% |
| Range | 54.2% | 27.3% |
| Mean | 84.4% | 87.5% |
| Median | 83.5% | 86.0% |
| Interquartile 25% (IQ1) | 81.1% | 84.6% |
| Interquartile 75% (IQ3) | 91.4% | 89.0% |
| Interquartile Range (IQR) | 10.3% | 4.4% |
| Standard Deviation (Sample) | 11.1% | 5.9% |
| Standard Deviation (Population) | 11.0% | 5.8% |
Similar Demographics by In Labor Force | Age 35-44
Demographics Similar to Basques by In Labor Force | Age 35-44
In terms of in labor force | age 35-44, the demographic groups most similar to Basques are Japanese (83.6%, a difference of 0.020%), Tsimshian (83.5%, a difference of 0.020%), Immigrants from the Azores (83.6%, a difference of 0.030%), Immigrants from El Salvador (83.5%, a difference of 0.050%), and Tongan (83.6%, a difference of 0.060%).
| Demographics | Rating | Rank | In Labor Force | Age 35-44 |
| Whites/Caucasians | 0.5 /100 | #250 | Tragic 83.6% |
| Salvadorans | 0.4 /100 | #251 | Tragic 83.6% |
| Immigrants | Guyana | 0.4 /100 | #252 | Tragic 83.6% |
| Lebanese | 0.4 /100 | #253 | Tragic 83.6% |
| Tongans | 0.4 /100 | #254 | Tragic 83.6% |
| Immigrants | Azores | 0.3 /100 | #255 | Tragic 83.6% |
| Japanese | 0.3 /100 | #256 | Tragic 83.6% |
| Basques | 0.3 /100 | #257 | Tragic 83.6% |
| Tsimshian | 0.2 /100 | #258 | Tragic 83.5% |
| Immigrants | El Salvador | 0.2 /100 | #259 | Tragic 83.5% |
| Vietnamese | 0.2 /100 | #260 | Tragic 83.5% |
| Immigrants | Dominica | 0.2 /100 | #261 | Tragic 83.5% |
| Immigrants | Congo | 0.2 /100 | #262 | Tragic 83.5% |
| Iroquois | 0.2 /100 | #263 | Tragic 83.5% |
| Scotch-Irish | 0.1 /100 | #264 | Tragic 83.5% |
Demographics Similar to Carpatho Rusyns by In Labor Force | Age 35-44
In terms of in labor force | age 35-44, the demographic groups most similar to Carpatho Rusyns are Immigrants from North Macedonia (85.6%, a difference of 0.0%), Slovene (85.6%, a difference of 0.0%), Norwegian (85.6%, a difference of 0.050%), Immigrants from Ireland (85.6%, a difference of 0.050%), and Immigrants from Serbia (85.5%, a difference of 0.050%).
| Demographics | Rating | Rank | In Labor Force | Age 35-44 |
| Immigrants | Cameroon | 100.0 /100 | #11 | Exceptional 85.8% |
| Liberians | 100.0 /100 | #12 | Exceptional 85.7% |
| Somalis | 100.0 /100 | #13 | Exceptional 85.6% |
| Immigrants | Somalia | 100.0 /100 | #14 | Exceptional 85.6% |
| Norwegians | 100.0 /100 | #15 | Exceptional 85.6% |
| Immigrants | Ireland | 100.0 /100 | #16 | Exceptional 85.6% |
| Immigrants | North Macedonia | 100.0 /100 | #17 | Exceptional 85.6% |
| Carpatho Rusyns | 100.0 /100 | #18 | Exceptional 85.6% |
| Slovenes | 100.0 /100 | #19 | Exceptional 85.6% |
| Immigrants | Serbia | 100.0 /100 | #20 | Exceptional 85.5% |
| Bulgarians | 100.0 /100 | #21 | Exceptional 85.5% |
| Immigrants | Bosnia and Herzegovina | 100.0 /100 | #22 | Exceptional 85.4% |
| Immigrants | Eastern Africa | 100.0 /100 | #23 | Exceptional 85.4% |
| Latvians | 99.9 /100 | #24 | Exceptional 85.4% |
| Paraguayans | 99.9 /100 | #25 | Exceptional 85.4% |