Immigrants from Europe vs Carpatho Rusyn In Labor Force | Age 35-44

COMPARE

Immigrants from Europe
Race
Ancestry
AfghanAfricanAlaska NativeAlaskan AthabascanAlbanianAleutAlsatianAmericanApacheArabArapahoArgentineanArmenianAssyrian/Chaldean/SyriacAustralianAustrianBahamianBangladeshiBarbadianBasqueBelgianBelizeanBermudanBhutaneseBlackfeetBolivianBrazilianBritishBritish West IndianBulgarianBurmeseCajunCambodianCanadianCape VerdeanCelticCentral AmericanCentral American IndianCherokeeCheyenneChickasawChileanChineseChippewaChoctawColombianColvilleComancheCosta RicanCreeCreekCroatianCrowCubanCypriotCzechCzechoslovakianDanishDelawareDominicanDutchDutch West IndianEastern EuropeanEcuadorianEgyptianEnglishEstonianEthiopianEuropeanFijianFilipinoFinnishFrenchFrench American IndianFrench CanadianGermanGerman RussianGhanaianGreekGuamanian/ChamorroGuatemalanGuyaneseHaitianHmongHonduranHopiHoumaHungarianIcelanderIndian (Asian)IndonesianInupiatIranianIraqiIrishIroquoisIsraeliItalianJamaicanJapaneseJordanianKenyanKiowaKoreanLaotianLatvianLebaneseLiberianLithuanianLumbeeLuxembourgerMacedonianMalaysianMalteseMarshalleseMenomineeMexicanMexican American IndianMongolianMoroccanNative HawaiianNavajoNepaleseNew ZealanderNicaraguanNigerianNorthern EuropeanNorwegianOkinawanOsageOttawaPaiutePakistaniPalestinianPanamanianParaguayanPennsylvania GermanPeruvianPimaPolishPortuguesePotawatomiPuebloPuerto RicanPuget Sound SalishRomanianRussianSalvadoranSamoanScandinavianScotch-IrishScottishSeminoleSenegaleseSerbianShoshoneSierra LeoneanSiouxSlavicSlovakSloveneSomaliSouth AfricanSouth AmericanSouth American IndianSoviet UnionSpaniardSpanishSpanish AmericanSpanish American IndianSri LankanSubsaharan AfricanSudaneseSwedishSwissSyrianTaiwaneseThaiTlingit-HaidaTohono O'OdhamTonganTrinidadian and TobagonianTsimshianTurkishU.S. Virgin IslanderUgandanUkrainianUruguayanUteVenezuelanVietnameseWelshWest IndianYakamaYaquiYugoslavianYumanYup'ikZimbabwean
Immigration
NonimmigrantsImmigrantsAfghanistanAfricaAlbaniaArgentinaArmeniaAsiaAustraliaAustriaBahamasBangladeshBarbadosBelarusBelgiumBelizeBoliviaBosnia and HerzegovinaBrazilBulgariaBurma/MyanmarCabo VerdeCambodiaCameroonCanadaCaribbeanCentral AmericaChileChinaColombiaCongoCosta RicaCroatiaCubaCzechoslovakiaDenmarkDominicaDominican RepublicEastern AfricaEastern AsiaEastern EuropeEcuadorEgyptEl SalvadorEnglandEritreaEthiopiaEuropeFijiFranceGermanyGhanaGreeceGrenadaGuatemalaGuyanaHaitiHondurasHong KongHungaryIndiaIndonesiaIranIraqIrelandIsraelItalyJamaicaJapanJordanKazakhstanKenyaKoreaKuwaitLaosLatin AmericaLatviaLebanonLiberiaLithuaniaMalaysiaMexicoMicronesiaMiddle AfricaMoldovaMoroccoNepalNetherlandsNicaraguaNigeriaNorth AmericaNorth MacedoniaNorthern AfricaNorthern EuropeNorwayOceaniaPakistanPanamaPeruPhilippinesPolandPortugalRomaniaRussiaSaudi ArabiaScotlandSenegalSerbiaSierra LeoneSingaporeSomaliaSouth AfricaSouth AmericaSouth Central AsiaSouth Eastern AsiaSouthern EuropeSpainSri LankaSt. Vincent and the GrenadinesSudanSwedenSwitzerlandSyriaTaiwanThailandTrinidad and TobagoTurkeyUgandaUkraineUruguayUzbekistanVenezuelaVietnamWest IndiesWestern AfricaWestern AsiaWestern EuropeYemenZaireZimbabweAzores
Carpatho Rusyn
Race
Ancestry
AfghanAfricanAlaska NativeAlaskan AthabascanAlbanianAleutAlsatianAmericanApacheArabArapahoArgentineanArmenianAssyrian/Chaldean/SyriacAustralianAustrianBahamianBangladeshiBarbadianBasqueBelgianBelizeanBermudanBhutaneseBlackfeetBolivianBrazilianBritishBritish West IndianBulgarianBurmeseCajunCambodianCanadianCape VerdeanCarpatho RusynCelticCentral AmericanCentral American IndianCherokeeCheyenneChickasawChileanChineseChippewaChoctawColombianColvilleComancheCosta RicanCreeCreekCroatianCrowCubanCypriotCzechCzechoslovakianDanishDelawareDominicanDutchDutch West IndianEastern EuropeanEcuadorianEgyptianEnglishEstonianEthiopianEuropeanFijianFilipinoFinnishFrenchFrench American IndianFrench CanadianGermanGerman RussianGhanaianGreekGuamanian/ChamorroGuatemalanGuyaneseHaitianHmongHonduranHopiHoumaHungarianIcelanderIndian (Asian)IndonesianInupiatIranianIraqiIrishIroquoisIsraeliItalianJamaicanJapaneseJordanianKenyanKiowaKoreanLaotianLatvianLebaneseLiberianLithuanianLumbeeLuxembourgerMacedonianMalaysianMalteseMarshalleseMenomineeMexicanMexican American IndianMongolianMoroccanNative HawaiianNavajoNepaleseNew ZealanderNicaraguanNigerianNorthern EuropeanNorwegianOkinawanOsageOttawaPaiutePakistaniPalestinianPanamanianParaguayanPennsylvania GermanPeruvianPimaPolishPortuguesePotawatomiPuebloPuerto RicanPuget Sound SalishRomanianRussianSalvadoranSamoanScandinavianScotch-IrishScottishSeminoleSenegaleseSerbianShoshoneSierra LeoneanSiouxSlavicSlovakSloveneSomaliSouth AfricanSouth AmericanSouth American IndianSoviet UnionSpaniardSpanishSpanish AmericanSpanish American IndianSri LankanSubsaharan AfricanSudaneseSwedishSwissSyrianTaiwaneseThaiTlingit-HaidaTohono O'OdhamTonganTrinidadian and TobagonianTsimshianTurkishU.S. Virgin IslanderUgandanUkrainianUruguayanUteVenezuelanVietnameseWelshWest IndianYakamaYaquiYugoslavianYumanYup'ikZimbabwean
Immigration
NonimmigrantsImmigrantsAfghanistanAfricaAlbaniaArgentinaArmeniaAsiaAustraliaAustriaBahamasBangladeshBarbadosBelarusBelgiumBelizeBoliviaBosnia and HerzegovinaBrazilBulgariaBurma/MyanmarCabo VerdeCambodiaCameroonCanadaCaribbeanCentral AmericaChileChinaColombiaCongoCosta RicaCroatiaCubaCzechoslovakiaDenmarkDominicaDominican RepublicEastern AfricaEastern AsiaEastern EuropeEcuadorEgyptEl SalvadorEnglandEritreaEthiopiaFijiFranceGermanyGhanaGreeceGrenadaGuatemalaGuyanaHaitiHondurasHong KongHungaryIndiaIndonesiaIranIraqIrelandIsraelItalyJamaicaJapanJordanKazakhstanKenyaKoreaKuwaitLaosLatin AmericaLatviaLebanonLiberiaLithuaniaMalaysiaMexicoMicronesiaMiddle AfricaMoldovaMoroccoNepalNetherlandsNicaraguaNigeriaNorth AmericaNorth MacedoniaNorthern AfricaNorthern EuropeNorwayOceaniaPakistanPanamaPeruPhilippinesPolandPortugalRomaniaRussiaSaudi ArabiaScotlandSenegalSerbiaSierra LeoneSingaporeSomaliaSouth AfricaSouth AmericaSouth Central AsiaSouth Eastern AsiaSouthern EuropeSpainSri LankaSt. Vincent and the GrenadinesSudanSwedenSwitzerlandSyriaTaiwanThailandTrinidad and TobagoTurkeyUgandaUkraineUruguayUzbekistanVenezuelaVietnamWest IndiesWestern AfricaWestern AsiaWestern EuropeYemenZaireZimbabweAzores
In Labor Force | Age 35-44
Income
Poverty
Unemployment
Labor Participation
Family Structure
Vehicle Availability
Education Level
Disability

In Labor Force | Age 35-44 Comparison

Immigrants from Europe

Carpatho Rusyns

Exceptional
Exceptional
84.9%
IN LABOR FORCE | AGE 35-44
97.2/ 100
METRIC RATING
91st/ 347
METRIC RANK
85.6%
IN LABOR FORCE | AGE 35-44
100.0/ 100
METRIC RATING
18th/ 347
METRIC RANK

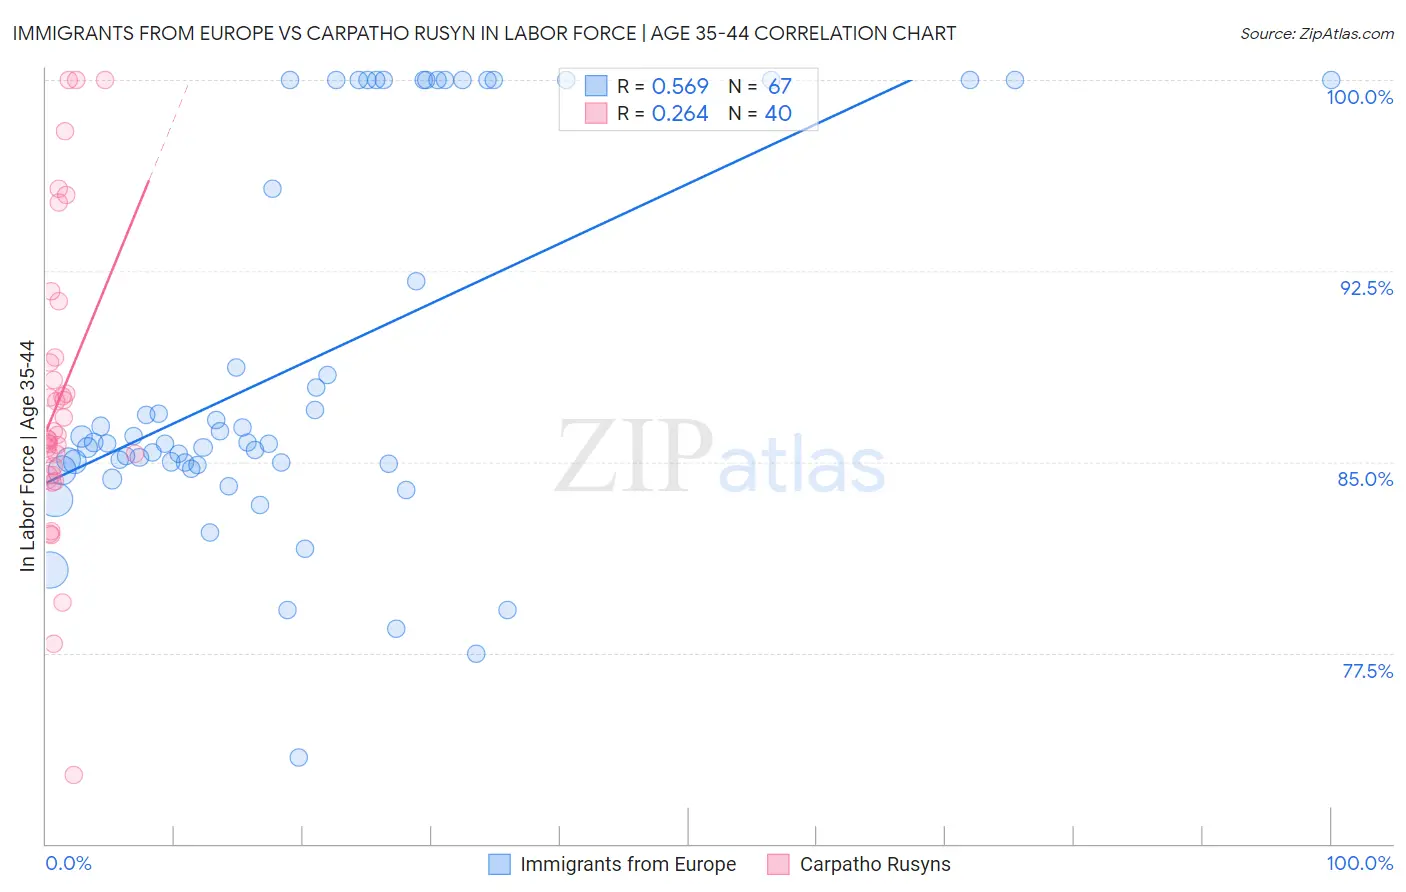
Immigrants from Europe vs Carpatho Rusyn In Labor Force | Age 35-44 Correlation Chart

The statistical analysis conducted on geographies consisting of 546,881,574 people shows a substantial positive correlation between the proportion of Immigrants from Europe and labor force participation rate among population between the ages 35 and 44 in the United States with a correlation coefficient (R) of 0.569 and weighted average of 84.9%. Similarly, the statistical analysis conducted on geographies consisting of 58,868,211 people shows a weak positive correlation between the proportion of Carpatho Rusyns and labor force participation rate among population between the ages 35 and 44 in the United States with a correlation coefficient (R) of 0.264 and weighted average of 85.6%, a difference of 0.84%.
Immigrants from Europe vs Carpatho Rusyn In Labor Force | Age 35-44

In Labor Force | Age 35-44 Correlation Summary

MeasurementImmigrants from EuropeCarpatho Rusyn
Minimum73.4%72.7%
Maximum100.0%100.0%
Range26.6%27.3%
Mean88.9%87.5%
Median85.7%86.0%
Interquartile 25% (IQ1)84.9%84.6%
Interquartile 75% (IQ3)100.0%89.0%
Interquartile Range (IQR)15.1%4.4%
Standard Deviation (Sample)7.4%5.9%
Standard Deviation (Population)7.3%5.8%

Similar Demographics by In Labor Force | Age 35-44

Demographics Similar to Immigrants from Europe by In Labor Force | Age 35-44

In terms of in labor force | age 35-44, the demographic groups most similar to Immigrants from Europe are Ghanaian (84.8%, a difference of 0.0%), Immigrants from France (84.9%, a difference of 0.010%), Immigrants from Northern Africa (84.8%, a difference of 0.010%), Immigrants from Pakistan (84.9%, a difference of 0.020%), and Mongolian (84.8%, a difference of 0.020%).
DemographicsRating | RankIn Labor Force | Age 35-44
Immigrants | Peru
97.8
/100
|
#84
Exceptional
84.9%
Immigrants | Middle Africa
97.8
/100
|
#85
Exceptional
84.9%
Greeks
97.8
/100
|
#86
Exceptional
84.9%
Belgians
97.7
/100
|
#87
Exceptional
84.9%
Yugoslavians
97.7
/100
|
#88
Exceptional
84.9%
Immigrants | Pakistan
97.5
/100
|
#89
Exceptional
84.9%
Immigrants | France
97.4
/100
|
#90
Exceptional
84.9%
Immigrants | Europe
97.2
/100
|
#91
Exceptional
84.9%
Ghanaians
97.2
/100
|
#92
Exceptional
84.8%
Immigrants | Northern Africa
97.1
/100
|
#93
Exceptional
84.8%
Mongolians
96.8
/100
|
#94
Exceptional
84.8%
Immigrants | Kuwait
96.7
/100
|
#95
Exceptional
84.8%
Cubans
96.6
/100
|
#96
Exceptional
84.8%
Egyptians
96.6
/100
|
#97
Exceptional
84.8%
Indians (Asian)
96.1
/100
|
#98
Exceptional
84.8%

Demographics Similar to Carpatho Rusyns by In Labor Force | Age 35-44

In terms of in labor force | age 35-44, the demographic groups most similar to Carpatho Rusyns are Immigrants from North Macedonia (85.6%, a difference of 0.0%), Slovene (85.6%, a difference of 0.0%), Norwegian (85.6%, a difference of 0.050%), Immigrants from Ireland (85.6%, a difference of 0.050%), and Immigrants from Serbia (85.5%, a difference of 0.050%).
DemographicsRating | RankIn Labor Force | Age 35-44
Immigrants | Cameroon
100.0
/100
|
#11
Exceptional
85.8%
Liberians
100.0
/100
|
#12
Exceptional
85.7%
Somalis
100.0
/100
|
#13
Exceptional
85.6%
Immigrants | Somalia
100.0
/100
|
#14
Exceptional
85.6%
Norwegians
100.0
/100
|
#15
Exceptional
85.6%
Immigrants | Ireland
100.0
/100
|
#16
Exceptional
85.6%
Immigrants | North Macedonia
100.0
/100
|
#17
Exceptional
85.6%
Carpatho Rusyns
100.0
/100
|
#18
Exceptional
85.6%
Slovenes
100.0
/100
|
#19
Exceptional
85.6%
Immigrants | Serbia
100.0
/100
|
#20
Exceptional
85.5%
Bulgarians
100.0
/100
|
#21
Exceptional
85.5%
Immigrants | Bosnia and Herzegovina
100.0
/100
|
#22
Exceptional
85.4%
Immigrants | Eastern Africa
100.0
/100
|
#23
Exceptional
85.4%
Latvians
99.9
/100
|
#24
Exceptional
85.4%
Paraguayans
99.9
/100
|
#25
Exceptional
85.4%