Somali vs Australian Unemployment Among Seniors over 75 years
COMPARE
Somali
Australian
Unemployment Among Seniors over 75 years
Unemployment Among Seniors over 75 years Comparison
Somalis
Australians
8.8%
UNEMPLOYMENT AMONG SENIORS OVER 75 YEARS
45.3/ 100
METRIC RATING
176th/ 347
METRIC RANK
8.7%
UNEMPLOYMENT AMONG SENIORS OVER 75 YEARS
50.3/ 100
METRIC RATING
173rd/ 347
METRIC RANK
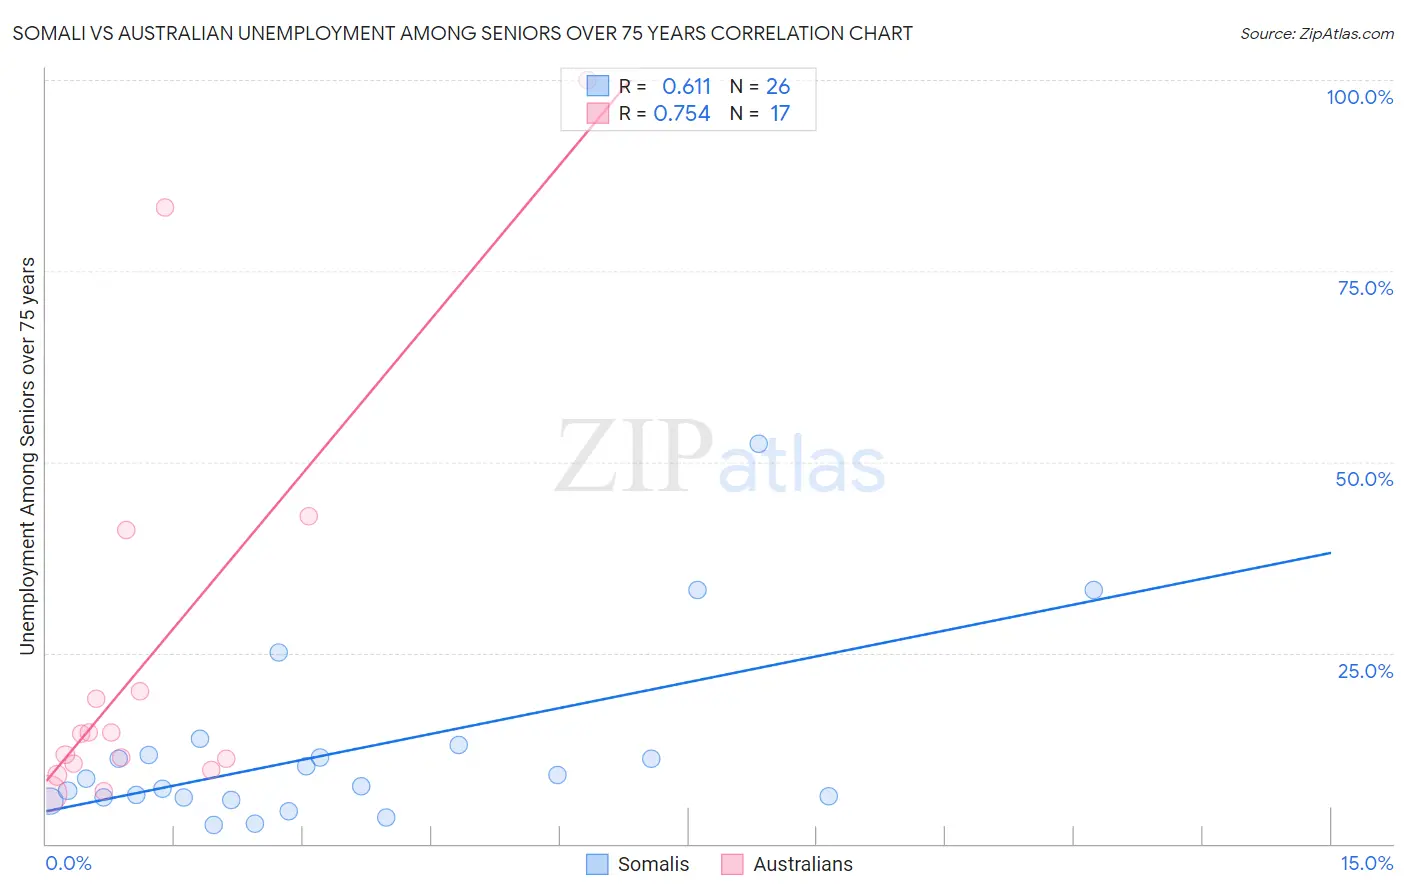
Somali vs Australian Unemployment Among Seniors over 75 years Correlation Chart
The statistical analysis conducted on geographies consisting of 71,654,664 people shows a significant positive correlation between the proportion of Somalis and unemployment rate among seniors over the age of 75 in the United States with a correlation coefficient (R) of 0.611 and weighted average of 8.8%. Similarly, the statistical analysis conducted on geographies consisting of 140,674,086 people shows a strong positive correlation between the proportion of Australians and unemployment rate among seniors over the age of 75 in the United States with a correlation coefficient (R) of 0.754 and weighted average of 8.7%, a difference of 0.27%.
Unemployment Among Seniors over 75 years Correlation Summary
| Measurement | Somali | Australian |
| Minimum | 2.5% | 6.5% |
| Maximum | 52.4% | 100.0% |
| Range | 49.9% | 93.5% |
| Mean | 12.1% | 25.1% |
| Median | 8.0% | 14.4% |
| Interquartile 25% (IQ1) | 6.0% | 10.1% |
| Interquartile 75% (IQ3) | 11.7% | 30.6% |
| Interquartile Range (IQR) | 5.6% | 20.5% |
| Standard Deviation (Sample) | 11.5% | 27.3% |
| Standard Deviation (Population) | 11.3% | 26.5% |
Demographics Similar to Somalis and Australians by Unemployment Among Seniors over 75 years
In terms of unemployment among seniors over 75 years, the demographic groups most similar to Somalis are Central American (8.8%, a difference of 0.11%), West Indian (8.8%, a difference of 0.19%), Immigrants from Italy (8.8%, a difference of 0.20%), Immigrants from Somalia (8.8%, a difference of 0.20%), and Syrian (8.7%, a difference of 0.23%). Similarly, the demographic groups most similar to Australians are Immigrants from El Salvador (8.7%, a difference of 0.030%), Syrian (8.7%, a difference of 0.040%), Dominican (8.7%, a difference of 0.080%), Immigrants (8.7%, a difference of 0.080%), and Zimbabwean (8.7%, a difference of 0.20%).
| Demographics | Rating | Rank | Unemployment Among Seniors over 75 years |
| Paraguayans | 62.2 /100 | #164 | Good 8.7% |
| Immigrants | Dominican Republic | 61.4 /100 | #165 | Good 8.7% |
| Immigrants | Belize | 57.6 /100 | #166 | Average 8.7% |
| Immigrants | Eastern Africa | 57.6 /100 | #167 | Average 8.7% |
| Immigrants | Lithuania | 57.2 /100 | #168 | Average 8.7% |
| Fijians | 56.4 /100 | #169 | Average 8.7% |
| Zimbabweans | 54.1 /100 | #170 | Average 8.7% |
| Dominicans | 51.9 /100 | #171 | Average 8.7% |
| Immigrants | Immigrants | 51.8 /100 | #172 | Average 8.7% |
| Australians | 50.3 /100 | #173 | Average 8.7% |
| Immigrants | El Salvador | 49.7 /100 | #174 | Average 8.7% |
| Syrians | 49.6 /100 | #175 | Average 8.7% |
| Somalis | 45.3 /100 | #176 | Average 8.8% |
| Central Americans | 43.3 /100 | #177 | Average 8.8% |
| West Indians | 41.9 /100 | #178 | Average 8.8% |
| Immigrants | Italy | 41.7 /100 | #179 | Average 8.8% |
| Immigrants | Somalia | 41.7 /100 | #180 | Average 8.8% |
| Immigrants | Thailand | 40.2 /100 | #181 | Average 8.8% |
| Guatemalans | 39.5 /100 | #182 | Fair 8.8% |
| Immigrants | Afghanistan | 38.2 /100 | #183 | Fair 8.8% |
| Immigrants | Micronesia | 37.2 /100 | #184 | Fair 8.8% |