Somali vs Sioux In Labor Force | Age 20-64
COMPARE
Somali
Sioux
In Labor Force | Age 20-64
In Labor Force | Age 20-64 Comparison
Somalis
Sioux
81.6%
IN LABOR FORCE | AGE 20-64
100.0/ 100
METRIC RATING
6th/ 347
METRIC RANK
75.0%
IN LABOR FORCE | AGE 20-64
0.0/ 100
METRIC RATING
327th/ 347
METRIC RANK
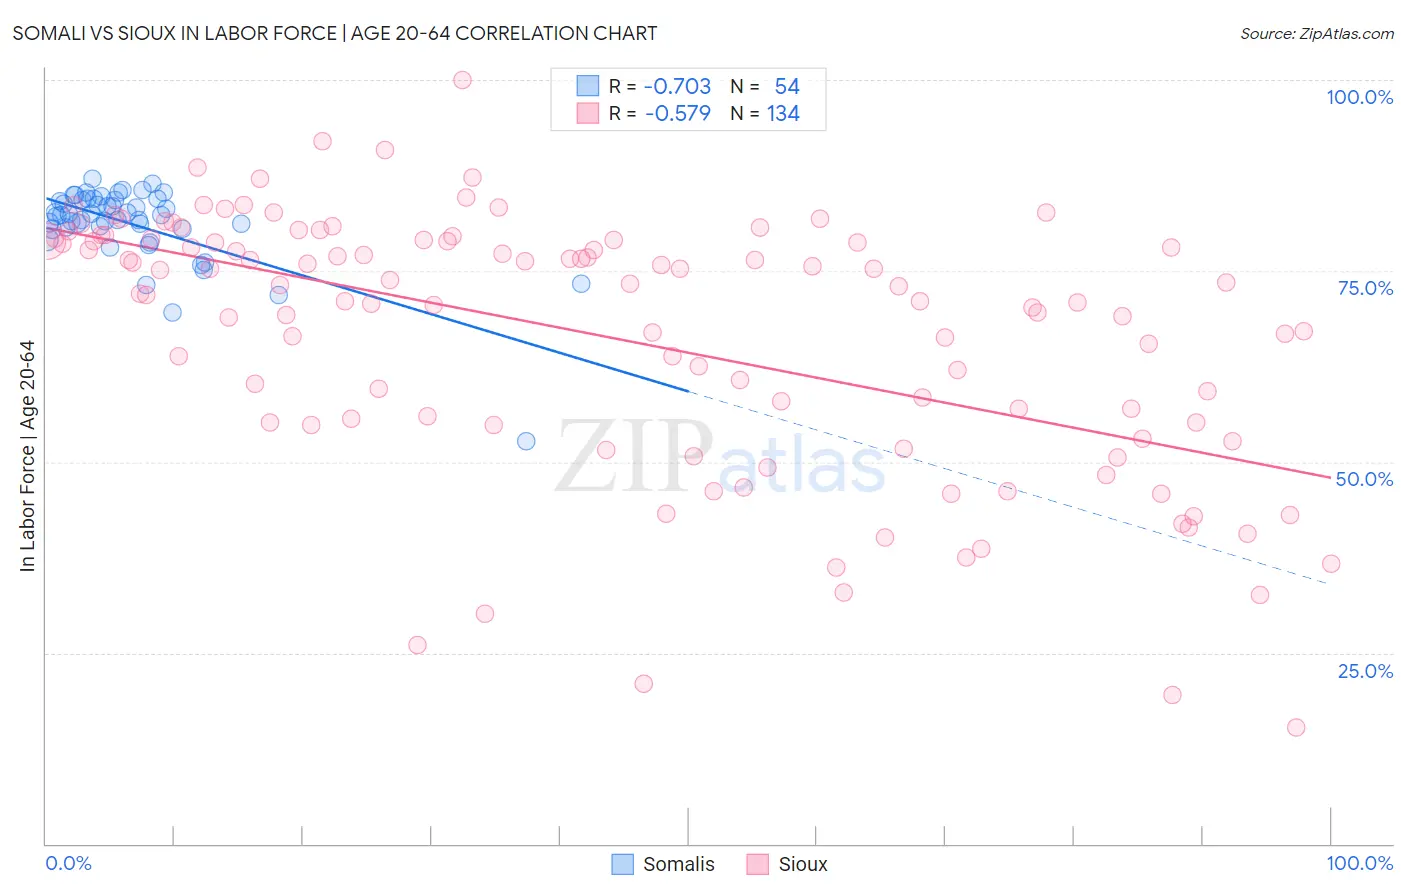
Somali vs Sioux In Labor Force | Age 20-64 Correlation Chart
The statistical analysis conducted on geographies consisting of 99,331,399 people shows a strong negative correlation between the proportion of Somalis and labor force participation rate among population between the ages 20 and 64 in the United States with a correlation coefficient (R) of -0.703 and weighted average of 81.6%. Similarly, the statistical analysis conducted on geographies consisting of 234,178,381 people shows a substantial negative correlation between the proportion of Sioux and labor force participation rate among population between the ages 20 and 64 in the United States with a correlation coefficient (R) of -0.579 and weighted average of 75.0%, a difference of 8.8%.
In Labor Force | Age 20-64 Correlation Summary
| Measurement | Somali | Sioux |
| Minimum | 52.7% | 15.2% |
| Maximum | 87.1% | 100.0% |
| Range | 34.4% | 84.8% |
| Mean | 81.0% | 66.4% |
| Median | 82.3% | 72.5% |
| Interquartile 25% (IQ1) | 80.5% | 55.2% |
| Interquartile 75% (IQ3) | 84.3% | 79.0% |
| Interquartile Range (IQR) | 3.8% | 23.8% |
| Standard Deviation (Sample) | 5.5% | 17.0% |
| Standard Deviation (Population) | 5.4% | 17.0% |
Similar Demographics by In Labor Force | Age 20-64
Demographics Similar to Somalis by In Labor Force | Age 20-64
In terms of in labor force | age 20-64, the demographic groups most similar to Somalis are Immigrants from Cameroon (81.6%, a difference of 0.040%), Immigrants from Somalia (81.6%, a difference of 0.060%), Sierra Leonean (81.5%, a difference of 0.060%), Bolivian (81.7%, a difference of 0.11%), and Immigrants from Sierra Leone (81.5%, a difference of 0.18%).
| Demographics | Rating | Rank | In Labor Force | Age 20-64 |
| Immigrants | Ethiopia | 100.0 /100 | #1 | Exceptional 82.1% |
| Ethiopians | 100.0 /100 | #2 | Exceptional 82.0% |
| Immigrants | Bolivia | 100.0 /100 | #3 | Exceptional 81.9% |
| Luxembourgers | 100.0 /100 | #4 | Exceptional 81.9% |
| Bolivians | 100.0 /100 | #5 | Exceptional 81.7% |
| Somalis | 100.0 /100 | #6 | Exceptional 81.6% |
| Immigrants | Cameroon | 100.0 /100 | #7 | Exceptional 81.6% |
| Immigrants | Somalia | 100.0 /100 | #8 | Exceptional 81.6% |
| Sierra Leoneans | 100.0 /100 | #9 | Exceptional 81.5% |
| Immigrants | Sierra Leone | 100.0 /100 | #10 | Exceptional 81.5% |
| Immigrants | Eastern Africa | 100.0 /100 | #11 | Exceptional 81.3% |
| Immigrants | Eritrea | 100.0 /100 | #12 | Exceptional 81.3% |
| Immigrants | India | 100.0 /100 | #13 | Exceptional 81.3% |
| Cambodians | 100.0 /100 | #14 | Exceptional 81.1% |
| Bulgarians | 100.0 /100 | #15 | Exceptional 81.1% |
Demographics Similar to Sioux by In Labor Force | Age 20-64
In terms of in labor force | age 20-64, the demographic groups most similar to Sioux are Kiowa (75.0%, a difference of 0.030%), Creek (75.1%, a difference of 0.18%), Cheyenne (74.8%, a difference of 0.23%), Colville (74.8%, a difference of 0.29%), and Menominee (75.3%, a difference of 0.40%).
| Demographics | Rating | Rank | In Labor Force | Age 20-64 |
| Yakama | 0.0 /100 | #320 | Tragic 75.8% |
| Seminole | 0.0 /100 | #321 | Tragic 75.5% |
| Dutch West Indians | 0.0 /100 | #322 | Tragic 75.5% |
| Cajuns | 0.0 /100 | #323 | Tragic 75.5% |
| Choctaw | 0.0 /100 | #324 | Tragic 75.4% |
| Menominee | 0.0 /100 | #325 | Tragic 75.3% |
| Creek | 0.0 /100 | #326 | Tragic 75.1% |
| Sioux | 0.0 /100 | #327 | Tragic 75.0% |
| Kiowa | 0.0 /100 | #328 | Tragic 75.0% |
| Cheyenne | 0.0 /100 | #329 | Tragic 74.8% |
| Colville | 0.0 /100 | #330 | Tragic 74.8% |
| Paiute | 0.0 /100 | #331 | Tragic 74.7% |
| Arapaho | 0.0 /100 | #332 | Tragic 74.4% |
| Natives/Alaskans | 0.0 /100 | #333 | Tragic 73.9% |
| Apache | 0.0 /100 | #334 | Tragic 73.7% |