Somali vs Australian Single Mother Households
COMPARE
Somali
Australian
Single Mother Households
Single Mother Households Comparison
Somalis
Australians
7.5%
SINGLE MOTHER HOUSEHOLDS
0.1/ 100
METRIC RATING
269th/ 347
METRIC RANK
5.6%
SINGLE MOTHER HOUSEHOLDS
98.7/ 100
METRIC RATING
61st/ 347
METRIC RANK
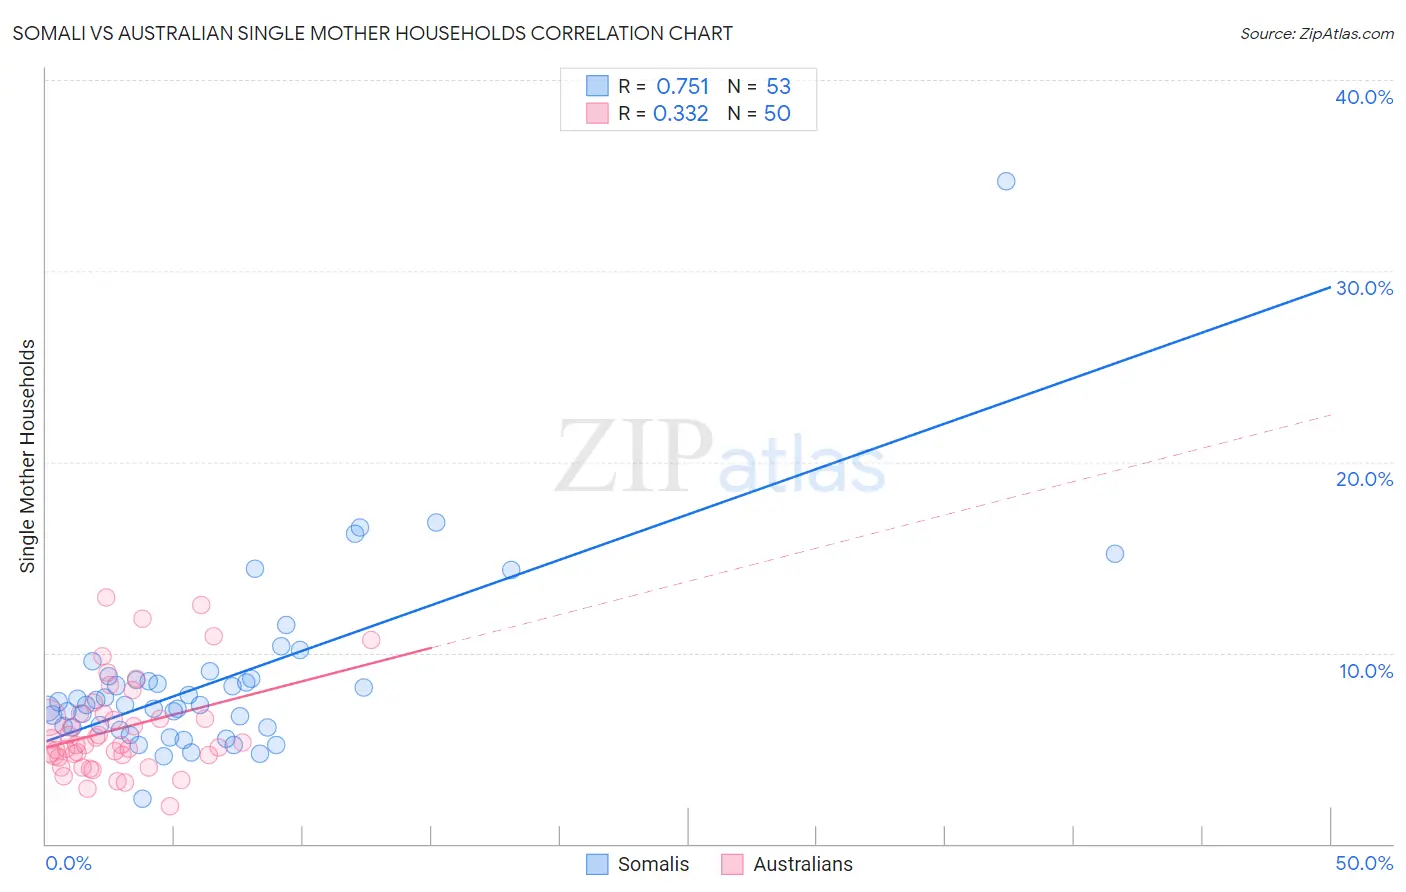
Somali vs Australian Single Mother Households Correlation Chart
The statistical analysis conducted on geographies consisting of 99,265,723 people shows a strong positive correlation between the proportion of Somalis and percentage of single mother households in the United States with a correlation coefficient (R) of 0.751 and weighted average of 7.5%. Similarly, the statistical analysis conducted on geographies consisting of 223,630,517 people shows a mild positive correlation between the proportion of Australians and percentage of single mother households in the United States with a correlation coefficient (R) of 0.332 and weighted average of 5.6%, a difference of 34.9%.
Single Mother Households Correlation Summary
| Measurement | Somali | Australian |
| Minimum | 2.4% | 1.9% |
| Maximum | 34.7% | 12.9% |
| Range | 32.3% | 11.0% |
| Mean | 8.6% | 6.0% |
| Median | 7.3% | 5.2% |
| Interquartile 25% (IQ1) | 6.1% | 4.6% |
| Interquartile 75% (IQ3) | 8.7% | 6.8% |
| Interquartile Range (IQR) | 2.6% | 2.2% |
| Standard Deviation (Sample) | 4.8% | 2.5% |
| Standard Deviation (Population) | 4.8% | 2.5% |
Similar Demographics by Single Mother Households
Demographics Similar to Somalis by Single Mother Households
In terms of single mother households, the demographic groups most similar to Somalis are Immigrants from Cuba (7.5%, a difference of 0.16%), Salvadoran (7.5%, a difference of 0.25%), Immigrants from the Azores (7.5%, a difference of 0.25%), Indonesian (7.5%, a difference of 0.41%), and Blackfeet (7.5%, a difference of 0.45%).
| Demographics | Rating | Rank | Single Mother Households |
| Immigrants | Somalia | 0.2 /100 | #262 | Tragic 7.4% |
| Immigrants | Nicaragua | 0.2 /100 | #263 | Tragic 7.4% |
| Yaqui | 0.1 /100 | #264 | Tragic 7.4% |
| Crow | 0.1 /100 | #265 | Tragic 7.4% |
| Nepalese | 0.1 /100 | #266 | Tragic 7.5% |
| Blackfeet | 0.1 /100 | #267 | Tragic 7.5% |
| Indonesians | 0.1 /100 | #268 | Tragic 7.5% |
| Somalis | 0.1 /100 | #269 | Tragic 7.5% |
| Immigrants | Cuba | 0.1 /100 | #270 | Tragic 7.5% |
| Salvadorans | 0.1 /100 | #271 | Tragic 7.5% |
| Immigrants | Azores | 0.1 /100 | #272 | Tragic 7.5% |
| Belizeans | 0.1 /100 | #273 | Tragic 7.6% |
| Immigrants | Guyana | 0.1 /100 | #274 | Tragic 7.6% |
| Central American Indians | 0.1 /100 | #275 | Tragic 7.6% |
| Guyanese | 0.1 /100 | #276 | Tragic 7.6% |
Demographics Similar to Australians by Single Mother Households
In terms of single mother households, the demographic groups most similar to Australians are Polish (5.6%, a difference of 0.010%), Immigrants from Norway (5.6%, a difference of 0.070%), Immigrants from North Macedonia (5.6%, a difference of 0.080%), Immigrants from France (5.6%, a difference of 0.12%), and Greek (5.6%, a difference of 0.16%).
| Demographics | Rating | Rank | Single Mother Households |
| Immigrants | Lebanon | 99.1 /100 | #54 | Exceptional 5.5% |
| Immigrants | Denmark | 99.1 /100 | #55 | Exceptional 5.5% |
| Immigrants | Romania | 99.0 /100 | #56 | Exceptional 5.5% |
| Immigrants | Europe | 99.0 /100 | #57 | Exceptional 5.5% |
| Danes | 98.9 /100 | #58 | Exceptional 5.5% |
| Luxembourgers | 98.7 /100 | #59 | Exceptional 5.6% |
| Immigrants | Norway | 98.7 /100 | #60 | Exceptional 5.6% |
| Australians | 98.7 /100 | #61 | Exceptional 5.6% |
| Poles | 98.6 /100 | #62 | Exceptional 5.6% |
| Immigrants | North Macedonia | 98.6 /100 | #63 | Exceptional 5.6% |
| Immigrants | France | 98.6 /100 | #64 | Exceptional 5.6% |
| Greeks | 98.6 /100 | #65 | Exceptional 5.6% |
| Immigrants | Canada | 98.5 /100 | #66 | Exceptional 5.6% |
| Italians | 98.5 /100 | #67 | Exceptional 5.6% |
| Immigrants | Bulgaria | 98.5 /100 | #68 | Exceptional 5.6% |