Sioux vs Arab In Labor Force | Age 30-34
COMPARE
Sioux
Arab
In Labor Force | Age 30-34
In Labor Force | Age 30-34 Comparison
Sioux
Arabs
80.4%
IN LABOR FORCE | AGE 30-34
0.0/ 100
METRIC RATING
328th/ 347
METRIC RANK
84.3%
IN LABOR FORCE | AGE 30-34
8.9/ 100
METRIC RATING
208th/ 347
METRIC RANK
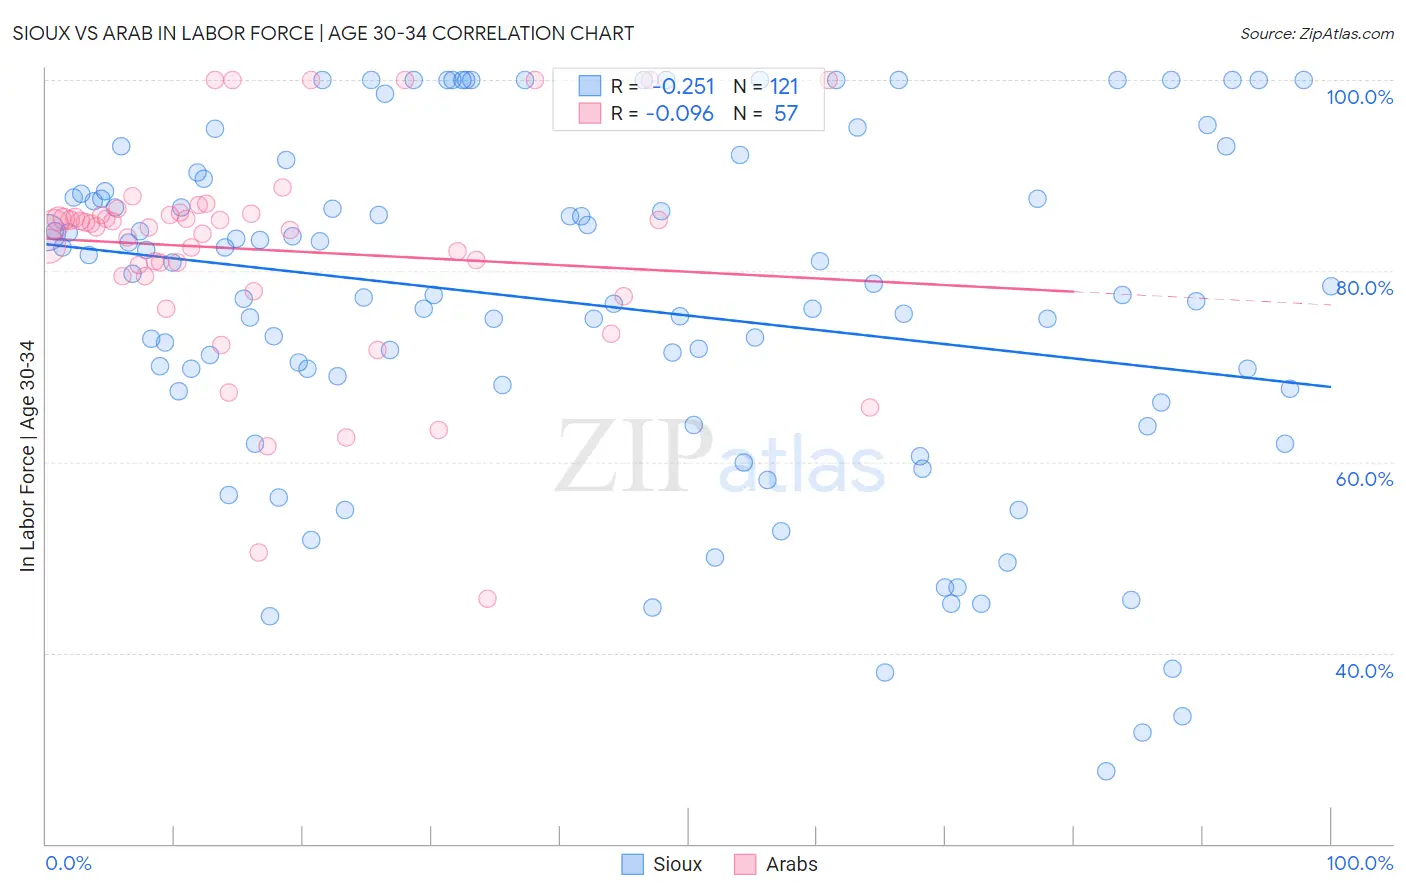
Sioux vs Arab In Labor Force | Age 30-34 Correlation Chart
The statistical analysis conducted on geographies consisting of 234,072,286 people shows a weak negative correlation between the proportion of Sioux and labor force participation rate among population between the ages 30 and 34 in the United States with a correlation coefficient (R) of -0.251 and weighted average of 80.4%. Similarly, the statistical analysis conducted on geographies consisting of 486,369,890 people shows a slight negative correlation between the proportion of Arabs and labor force participation rate among population between the ages 30 and 34 in the United States with a correlation coefficient (R) of -0.096 and weighted average of 84.3%, a difference of 4.9%.
In Labor Force | Age 30-34 Correlation Summary
| Measurement | Sioux | Arab |
| Minimum | 27.6% | 45.6% |
| Maximum | 100.0% | 100.0% |
| Range | 72.4% | 54.4% |
| Mean | 76.6% | 82.2% |
| Median | 78.4% | 84.9% |
| Interquartile 25% (IQ1) | 67.6% | 79.5% |
| Interquartile 75% (IQ3) | 88.2% | 86.0% |
| Interquartile Range (IQR) | 20.6% | 6.5% |
| Standard Deviation (Sample) | 17.9% | 11.1% |
| Standard Deviation (Population) | 17.8% | 11.0% |
Similar Demographics by In Labor Force | Age 30-34
Demographics Similar to Sioux by In Labor Force | Age 30-34
In terms of in labor force | age 30-34, the demographic groups most similar to Sioux are Creek (80.4%, a difference of 0.010%), Colville (80.7%, a difference of 0.41%), Pueblo (80.0%, a difference of 0.41%), Houma (79.9%, a difference of 0.58%), and Seminole (80.8%, a difference of 0.60%).
| Demographics | Rating | Rank | In Labor Force | Age 30-34 |
| Alaska Natives | 0.0 /100 | #321 | Tragic 81.3% |
| Puerto Ricans | 0.0 /100 | #322 | Tragic 81.2% |
| Paiute | 0.0 /100 | #323 | Tragic 81.2% |
| Cheyenne | 0.0 /100 | #324 | Tragic 81.1% |
| Dutch West Indians | 0.0 /100 | #325 | Tragic 81.0% |
| Seminole | 0.0 /100 | #326 | Tragic 80.8% |
| Colville | 0.0 /100 | #327 | Tragic 80.7% |
| Sioux | 0.0 /100 | #328 | Tragic 80.4% |
| Creek | 0.0 /100 | #329 | Tragic 80.4% |
| Pueblo | 0.0 /100 | #330 | Tragic 80.0% |
| Houma | 0.0 /100 | #331 | Tragic 79.9% |
| Kiowa | 0.0 /100 | #332 | Tragic 79.8% |
| Inupiat | 0.0 /100 | #333 | Tragic 79.7% |
| Hopi | 0.0 /100 | #334 | Tragic 79.3% |
| Marshallese | 0.0 /100 | #335 | Tragic 79.2% |
Demographics Similar to Arabs by In Labor Force | Age 30-34
In terms of in labor force | age 30-34, the demographic groups most similar to Arabs are Jamaican (84.3%, a difference of 0.0%), Indonesian (84.3%, a difference of 0.0%), Japanese (84.3%, a difference of 0.0%), Bangladeshi (84.3%, a difference of 0.010%), and Immigrants from Western Asia (84.3%, a difference of 0.010%).
| Demographics | Rating | Rank | In Labor Force | Age 30-34 |
| Trinidadians and Tobagonians | 18.2 /100 | #201 | Poor 84.5% |
| Immigrants | West Indies | 18.1 /100 | #202 | Poor 84.5% |
| Canadians | 15.4 /100 | #203 | Poor 84.4% |
| Ecuadorians | 14.2 /100 | #204 | Poor 84.4% |
| French | 13.8 /100 | #205 | Poor 84.4% |
| Lebanese | 10.6 /100 | #206 | Poor 84.4% |
| Bangladeshis | 9.4 /100 | #207 | Tragic 84.3% |
| Arabs | 8.9 /100 | #208 | Tragic 84.3% |
| Jamaicans | 8.8 /100 | #209 | Tragic 84.3% |
| Indonesians | 8.8 /100 | #210 | Tragic 84.3% |
| Japanese | 8.8 /100 | #211 | Tragic 84.3% |
| Immigrants | Western Asia | 8.2 /100 | #212 | Tragic 84.3% |
| Immigrants | Jamaica | 7.9 /100 | #213 | Tragic 84.3% |
| Immigrants | Germany | 7.2 /100 | #214 | Tragic 84.3% |
| Europeans | 7.2 /100 | #215 | Tragic 84.3% |