Sioux vs Arab Unemployment Among Ages 25 to 29 years
COMPARE
Sioux
Arab
Unemployment Among Ages 25 to 29 years
Unemployment Among Ages 25 to 29 years Comparison
Sioux
Arabs
11.7%
UNEMPLOYMENT AMONG AGES 25 TO 29 YEARS
0.0/ 100
METRIC RATING
338th/ 347
METRIC RANK
6.5%
UNEMPLOYMENT AMONG AGES 25 TO 29 YEARS
82.5/ 100
METRIC RATING
124th/ 347
METRIC RANK
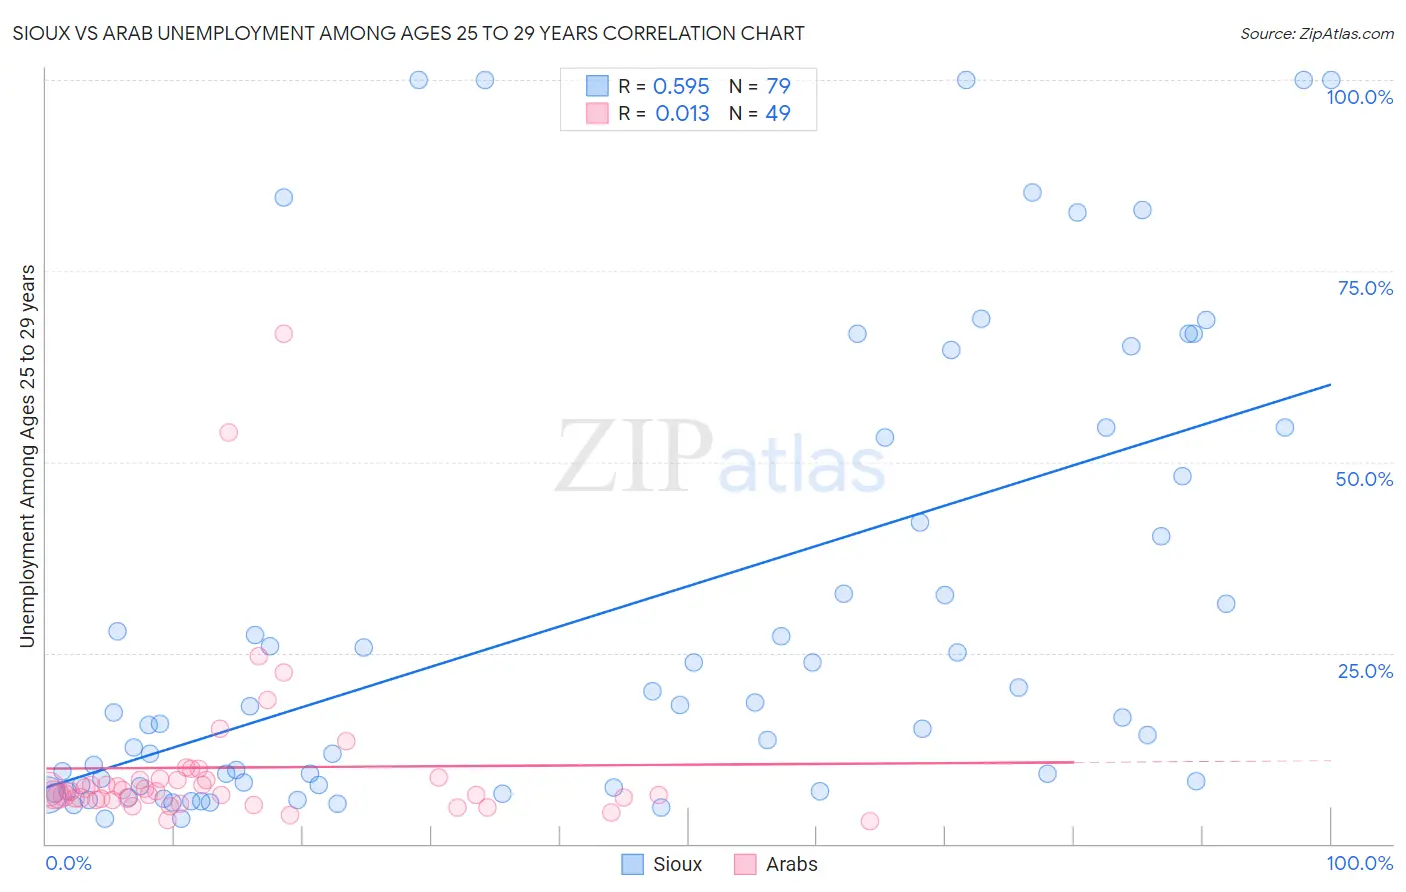
Sioux vs Arab Unemployment Among Ages 25 to 29 years Correlation Chart
The statistical analysis conducted on geographies consisting of 224,112,543 people shows a substantial positive correlation between the proportion of Sioux and unemployment rate among population between the ages 25 and 29 in the United States with a correlation coefficient (R) of 0.595 and weighted average of 11.7%. Similarly, the statistical analysis conducted on geographies consisting of 454,763,852 people shows no correlation between the proportion of Arabs and unemployment rate among population between the ages 25 and 29 in the United States with a correlation coefficient (R) of 0.013 and weighted average of 6.5%, a difference of 79.8%.
Unemployment Among Ages 25 to 29 years Correlation Summary
| Measurement | Sioux | Arab |
| Minimum | 3.3% | 3.0% |
| Maximum | 100.0% | 66.7% |
| Range | 96.7% | 63.7% |
| Mean | 29.7% | 10.0% |
| Median | 16.6% | 6.8% |
| Interquartile 25% (IQ1) | 7.5% | 5.8% |
| Interquartile 75% (IQ3) | 48.1% | 8.4% |
| Interquartile Range (IQR) | 40.6% | 2.6% |
| Standard Deviation (Sample) | 29.5% | 11.4% |
| Standard Deviation (Population) | 29.3% | 11.3% |
Similar Demographics by Unemployment Among Ages 25 to 29 years
Demographics Similar to Sioux by Unemployment Among Ages 25 to 29 years
In terms of unemployment among ages 25 to 29 years, the demographic groups most similar to Sioux are Pima (11.8%, a difference of 0.94%), Cheyenne (11.8%, a difference of 1.4%), Tohono O'odham (12.1%, a difference of 3.5%), Menominee (11.3%, a difference of 3.5%), and Lumbee (11.2%, a difference of 3.8%).
| Demographics | Rating | Rank | Unemployment Among Ages 25 to 29 years |
| Alaska Natives | 0.0 /100 | #331 | Tragic 10.2% |
| Pueblo | 0.0 /100 | #332 | Tragic 10.4% |
| Alaskan Athabascans | 0.0 /100 | #333 | Tragic 10.8% |
| Yuman | 0.0 /100 | #334 | Tragic 11.0% |
| Puerto Ricans | 0.0 /100 | #335 | Tragic 11.1% |
| Lumbee | 0.0 /100 | #336 | Tragic 11.2% |
| Menominee | 0.0 /100 | #337 | Tragic 11.3% |
| Sioux | 0.0 /100 | #338 | Tragic 11.7% |
| Pima | 0.0 /100 | #339 | Tragic 11.8% |
| Cheyenne | 0.0 /100 | #340 | Tragic 11.8% |
| Tohono O'odham | 0.0 /100 | #341 | Tragic 12.1% |
| Navajo | 0.0 /100 | #342 | Tragic 12.2% |
| Inupiat | 0.0 /100 | #343 | Tragic 13.4% |
| Hopi | 0.0 /100 | #344 | Tragic 13.5% |
| Arapaho | 0.0 /100 | #345 | Tragic 15.4% |
Demographics Similar to Arabs by Unemployment Among Ages 25 to 29 years
In terms of unemployment among ages 25 to 29 years, the demographic groups most similar to Arabs are Syrian (6.5%, a difference of 0.040%), Brazilian (6.5%, a difference of 0.060%), Laotian (6.5%, a difference of 0.12%), Immigrants from Belarus (6.5%, a difference of 0.14%), and Dutch (6.5%, a difference of 0.19%).
| Demographics | Rating | Rank | Unemployment Among Ages 25 to 29 years |
| Immigrants | Uruguay | 85.7 /100 | #117 | Excellent 6.5% |
| Chileans | 85.3 /100 | #118 | Excellent 6.5% |
| Immigrants | South Africa | 84.9 /100 | #119 | Excellent 6.5% |
| Immigrants | Moldova | 84.5 /100 | #120 | Excellent 6.5% |
| Immigrants | Uganda | 84.5 /100 | #121 | Excellent 6.5% |
| Immigrants | Belarus | 83.7 /100 | #122 | Excellent 6.5% |
| Laotians | 83.6 /100 | #123 | Excellent 6.5% |
| Arabs | 82.5 /100 | #124 | Excellent 6.5% |
| Syrians | 82.1 /100 | #125 | Excellent 6.5% |
| Brazilians | 81.9 /100 | #126 | Excellent 6.5% |
| Dutch | 80.6 /100 | #127 | Excellent 6.5% |
| Immigrants | Chile | 80.5 /100 | #128 | Excellent 6.5% |
| Sri Lankans | 80.3 /100 | #129 | Excellent 6.5% |
| Immigrants | Peru | 79.9 /100 | #130 | Good 6.5% |
| Immigrants | Afghanistan | 79.2 /100 | #131 | Good 6.5% |