Immigrants from Zaire vs Arab In Labor Force | Age 30-34
COMPARE
Immigrants from Zaire
Arab
In Labor Force | Age 30-34
In Labor Force | Age 30-34 Comparison
Immigrants from Zaire
Arabs
84.5%
IN LABOR FORCE | AGE 30-34
25.8/ 100
METRIC RATING
190th/ 347
METRIC RANK
84.3%
IN LABOR FORCE | AGE 30-34
8.9/ 100
METRIC RATING
208th/ 347
METRIC RANK
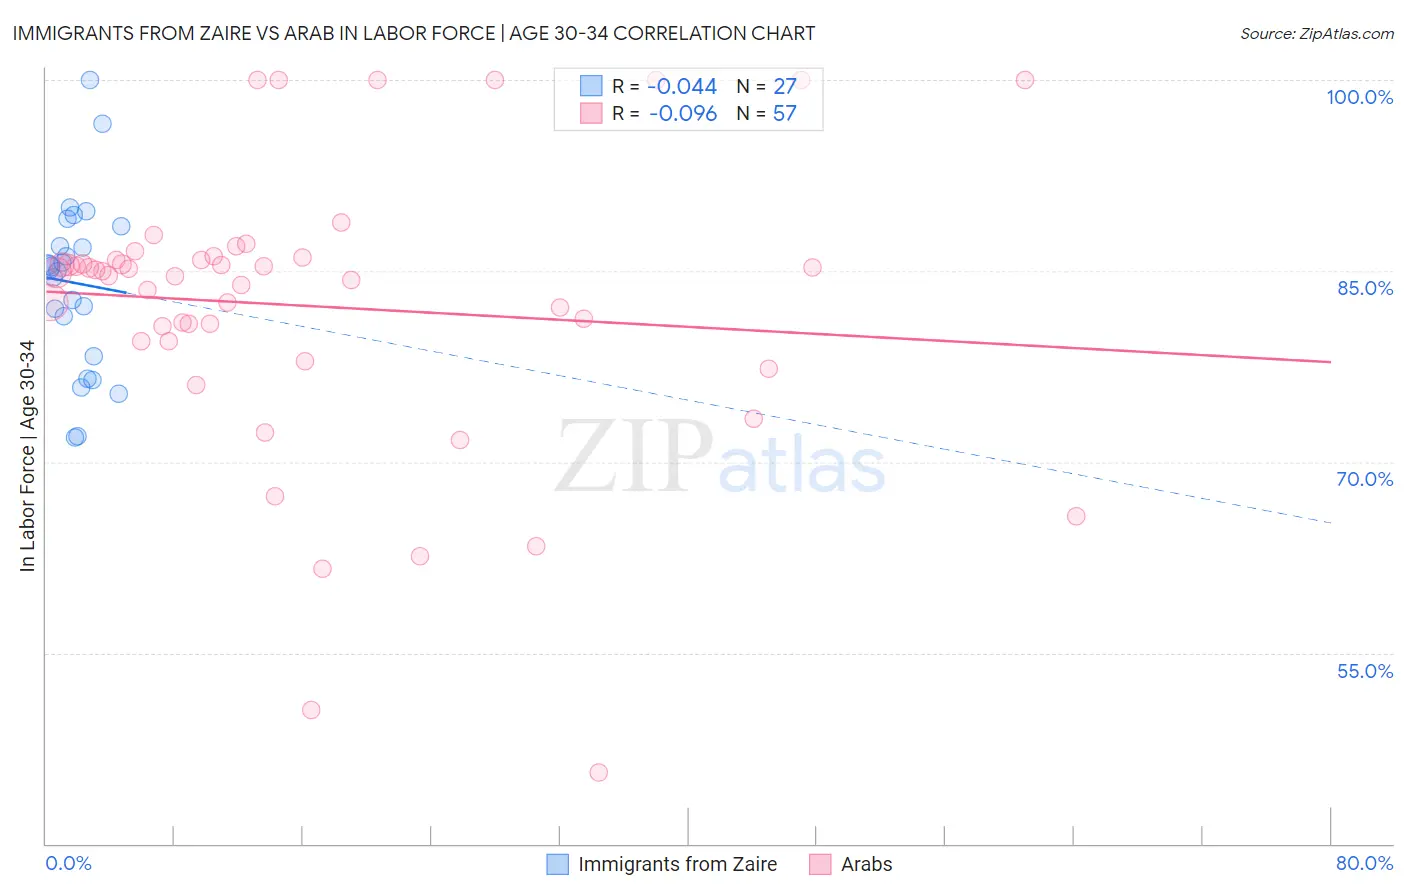
Immigrants from Zaire vs Arab In Labor Force | Age 30-34 Correlation Chart
The statistical analysis conducted on geographies consisting of 107,239,554 people shows no correlation between the proportion of Immigrants from Zaire and labor force participation rate among population between the ages 30 and 34 in the United States with a correlation coefficient (R) of -0.044 and weighted average of 84.5%. Similarly, the statistical analysis conducted on geographies consisting of 486,369,890 people shows a slight negative correlation between the proportion of Arabs and labor force participation rate among population between the ages 30 and 34 in the United States with a correlation coefficient (R) of -0.096 and weighted average of 84.3%, a difference of 0.23%.
In Labor Force | Age 30-34 Correlation Summary
| Measurement | Immigrants from Zaire | Arab |
| Minimum | 71.9% | 45.6% |
| Maximum | 100.0% | 100.0% |
| Range | 28.1% | 54.4% |
| Mean | 84.0% | 82.2% |
| Median | 85.3% | 84.9% |
| Interquartile 25% (IQ1) | 78.3% | 79.5% |
| Interquartile 75% (IQ3) | 88.5% | 86.0% |
| Interquartile Range (IQR) | 10.2% | 6.5% |
| Standard Deviation (Sample) | 6.7% | 11.1% |
| Standard Deviation (Population) | 6.6% | 11.0% |
Demographics Similar to Immigrants from Zaire and Arabs by In Labor Force | Age 30-34
In terms of in labor force | age 30-34, the demographic groups most similar to Immigrants from Zaire are Hungarian (84.5%, a difference of 0.010%), Scandinavian (84.5%, a difference of 0.010%), Immigrants from Costa Rica (84.5%, a difference of 0.020%), Immigrants from Afghanistan (84.5%, a difference of 0.020%), and Korean (84.5%, a difference of 0.020%). Similarly, the demographic groups most similar to Arabs are Jamaican (84.3%, a difference of 0.0%), Bangladeshi (84.3%, a difference of 0.010%), Lebanese (84.4%, a difference of 0.030%), Ecuadorian (84.4%, a difference of 0.090%), and French (84.4%, a difference of 0.090%).
| Demographics | Rating | Rank | In Labor Force | Age 30-34 |
| Nigerians | 28.9 /100 | #189 | Fair 84.5% |
| Immigrants | Zaire | 25.8 /100 | #190 | Fair 84.5% |
| Hungarians | 24.8 /100 | #191 | Fair 84.5% |
| Scandinavians | 24.7 /100 | #192 | Fair 84.5% |
| Immigrants | Costa Rica | 23.9 /100 | #193 | Fair 84.5% |
| Immigrants | Afghanistan | 23.5 /100 | #194 | Fair 84.5% |
| Koreans | 23.2 /100 | #195 | Fair 84.5% |
| British | 22.9 /100 | #196 | Fair 84.5% |
| Immigrants | Syria | 21.9 /100 | #197 | Fair 84.5% |
| Dutch | 20.2 /100 | #198 | Fair 84.5% |
| Immigrants | Thailand | 19.1 /100 | #199 | Poor 84.5% |
| Sub-Saharan Africans | 19.0 /100 | #200 | Poor 84.5% |
| Trinidadians and Tobagonians | 18.2 /100 | #201 | Poor 84.5% |
| Immigrants | West Indies | 18.1 /100 | #202 | Poor 84.5% |
| Canadians | 15.4 /100 | #203 | Poor 84.4% |
| Ecuadorians | 14.2 /100 | #204 | Poor 84.4% |
| French | 13.8 /100 | #205 | Poor 84.4% |
| Lebanese | 10.6 /100 | #206 | Poor 84.4% |
| Bangladeshis | 9.4 /100 | #207 | Tragic 84.3% |
| Arabs | 8.9 /100 | #208 | Tragic 84.3% |
| Jamaicans | 8.8 /100 | #209 | Tragic 84.3% |