Immigrants from Belize vs Arab In Labor Force | Age 30-34
COMPARE
Immigrants from Belize
Arab
In Labor Force | Age 30-34
In Labor Force | Age 30-34 Comparison
Immigrants from Belize
Arabs
83.2%
IN LABOR FORCE | AGE 30-34
0.0/ 100
METRIC RATING
284th/ 347
METRIC RANK
84.3%
IN LABOR FORCE | AGE 30-34
8.9/ 100
METRIC RATING
208th/ 347
METRIC RANK
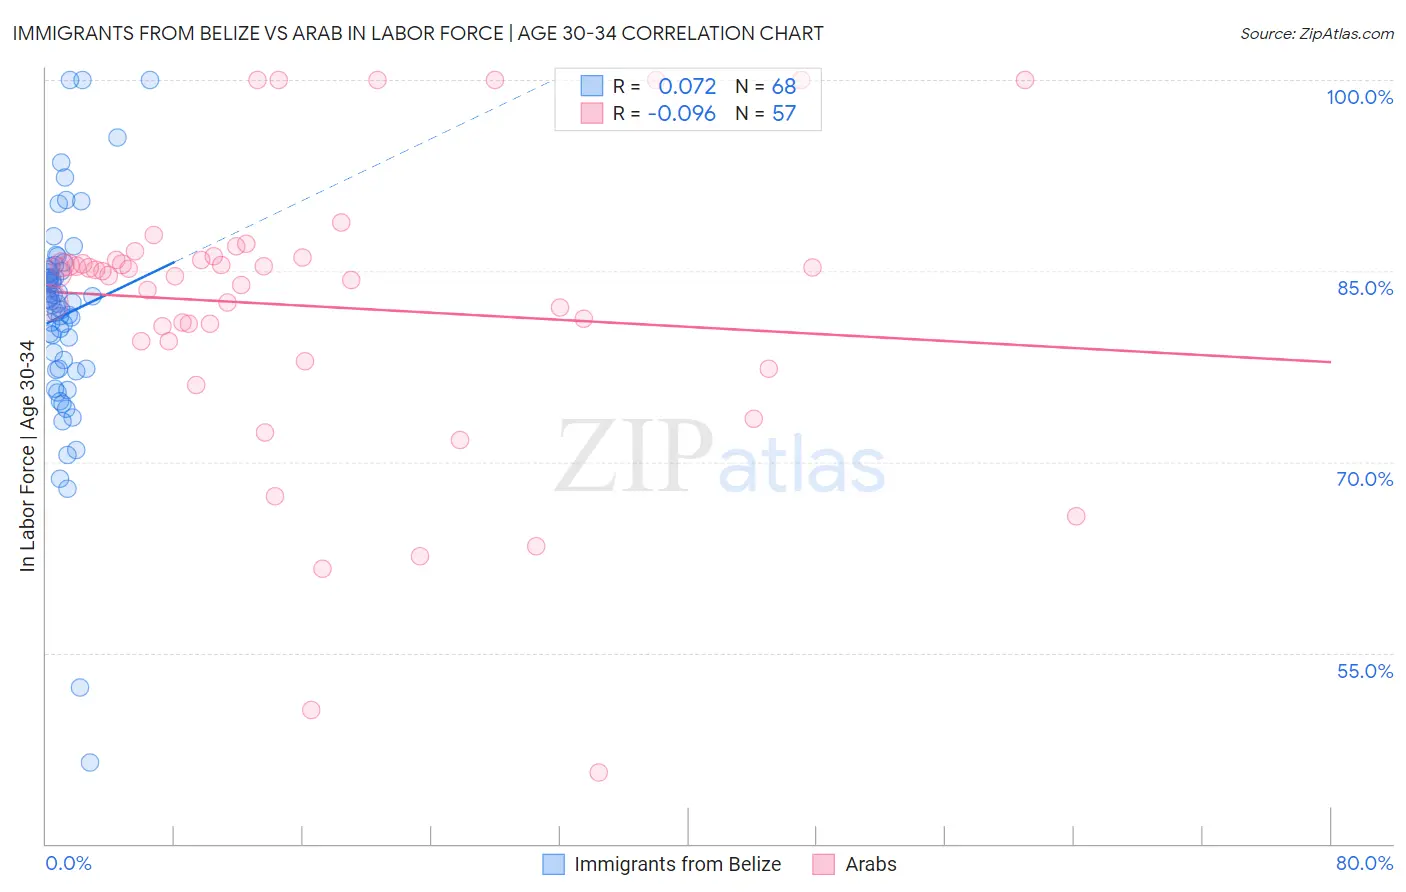
Immigrants from Belize vs Arab In Labor Force | Age 30-34 Correlation Chart
The statistical analysis conducted on geographies consisting of 130,310,300 people shows a slight positive correlation between the proportion of Immigrants from Belize and labor force participation rate among population between the ages 30 and 34 in the United States with a correlation coefficient (R) of 0.072 and weighted average of 83.2%. Similarly, the statistical analysis conducted on geographies consisting of 486,369,890 people shows a slight negative correlation between the proportion of Arabs and labor force participation rate among population between the ages 30 and 34 in the United States with a correlation coefficient (R) of -0.096 and weighted average of 84.3%, a difference of 1.4%.
In Labor Force | Age 30-34 Correlation Summary
| Measurement | Immigrants from Belize | Arab |
| Minimum | 46.4% | 45.6% |
| Maximum | 100.0% | 100.0% |
| Range | 53.6% | 54.4% |
| Mean | 81.5% | 82.2% |
| Median | 82.6% | 84.9% |
| Interquartile 25% (IQ1) | 77.3% | 79.5% |
| Interquartile 75% (IQ3) | 84.9% | 86.0% |
| Interquartile Range (IQR) | 7.6% | 6.5% |
| Standard Deviation (Sample) | 8.8% | 11.1% |
| Standard Deviation (Population) | 8.7% | 11.0% |
Similar Demographics by In Labor Force | Age 30-34
Demographics Similar to Immigrants from Belize by In Labor Force | Age 30-34
In terms of in labor force | age 30-34, the demographic groups most similar to Immigrants from Belize are Cree (83.2%, a difference of 0.0%), Assyrian/Chaldean/Syriac (83.2%, a difference of 0.050%), Immigrants from Latin America (83.1%, a difference of 0.060%), Mexican American Indian (83.2%, a difference of 0.070%), and Samoan (83.3%, a difference of 0.10%).
| Demographics | Rating | Rank | In Labor Force | Age 30-34 |
| Delaware | 0.0 /100 | #277 | Tragic 83.5% |
| Fijians | 0.0 /100 | #278 | Tragic 83.4% |
| Immigrants | Fiji | 0.0 /100 | #279 | Tragic 83.4% |
| Africans | 0.0 /100 | #280 | Tragic 83.4% |
| Samoans | 0.0 /100 | #281 | Tragic 83.3% |
| Mexican American Indians | 0.0 /100 | #282 | Tragic 83.2% |
| Assyrians/Chaldeans/Syriacs | 0.0 /100 | #283 | Tragic 83.2% |
| Immigrants | Belize | 0.0 /100 | #284 | Tragic 83.2% |
| Cree | 0.0 /100 | #285 | Tragic 83.2% |
| Immigrants | Latin America | 0.0 /100 | #286 | Tragic 83.1% |
| Native Hawaiians | 0.0 /100 | #287 | Tragic 83.0% |
| Central American Indians | 0.0 /100 | #288 | Tragic 83.0% |
| Hawaiians | 0.0 /100 | #289 | Tragic 83.0% |
| Blackfeet | 0.0 /100 | #290 | Tragic 82.8% |
| Potawatomi | 0.0 /100 | #291 | Tragic 82.8% |
Demographics Similar to Arabs by In Labor Force | Age 30-34
In terms of in labor force | age 30-34, the demographic groups most similar to Arabs are Jamaican (84.3%, a difference of 0.0%), Indonesian (84.3%, a difference of 0.0%), Japanese (84.3%, a difference of 0.0%), Bangladeshi (84.3%, a difference of 0.010%), and Immigrants from Western Asia (84.3%, a difference of 0.010%).
| Demographics | Rating | Rank | In Labor Force | Age 30-34 |
| Trinidadians and Tobagonians | 18.2 /100 | #201 | Poor 84.5% |
| Immigrants | West Indies | 18.1 /100 | #202 | Poor 84.5% |
| Canadians | 15.4 /100 | #203 | Poor 84.4% |
| Ecuadorians | 14.2 /100 | #204 | Poor 84.4% |
| French | 13.8 /100 | #205 | Poor 84.4% |
| Lebanese | 10.6 /100 | #206 | Poor 84.4% |
| Bangladeshis | 9.4 /100 | #207 | Tragic 84.3% |
| Arabs | 8.9 /100 | #208 | Tragic 84.3% |
| Jamaicans | 8.8 /100 | #209 | Tragic 84.3% |
| Indonesians | 8.8 /100 | #210 | Tragic 84.3% |
| Japanese | 8.8 /100 | #211 | Tragic 84.3% |
| Immigrants | Western Asia | 8.2 /100 | #212 | Tragic 84.3% |
| Immigrants | Jamaica | 7.9 /100 | #213 | Tragic 84.3% |
| Immigrants | Germany | 7.2 /100 | #214 | Tragic 84.3% |
| Europeans | 7.2 /100 | #215 | Tragic 84.3% |