Immigrants from Cuba vs Arab In Labor Force | Age 30-34
COMPARE
Immigrants from Cuba
Arab
In Labor Force | Age 30-34
In Labor Force | Age 30-34 Comparison
Immigrants from Cuba
Arabs
84.2%
IN LABOR FORCE | AGE 30-34
3.0/ 100
METRIC RATING
227th/ 347
METRIC RANK
84.3%
IN LABOR FORCE | AGE 30-34
8.9/ 100
METRIC RATING
208th/ 347
METRIC RANK
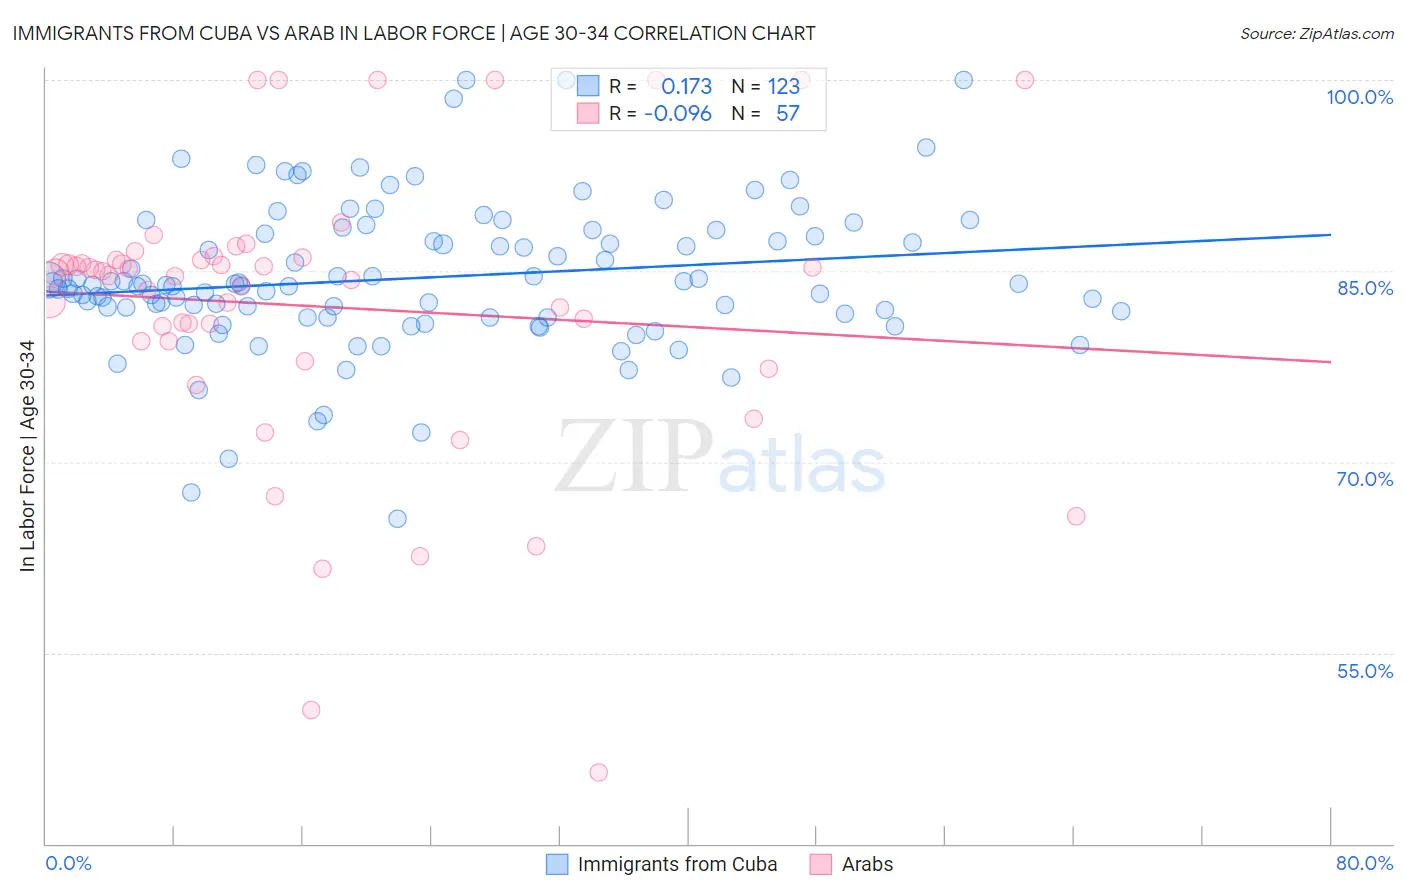
Immigrants from Cuba vs Arab In Labor Force | Age 30-34 Correlation Chart
The statistical analysis conducted on geographies consisting of 325,881,982 people shows a poor positive correlation between the proportion of Immigrants from Cuba and labor force participation rate among population between the ages 30 and 34 in the United States with a correlation coefficient (R) of 0.173 and weighted average of 84.2%. Similarly, the statistical analysis conducted on geographies consisting of 486,369,890 people shows a slight negative correlation between the proportion of Arabs and labor force participation rate among population between the ages 30 and 34 in the United States with a correlation coefficient (R) of -0.096 and weighted average of 84.3%, a difference of 0.20%.
In Labor Force | Age 30-34 Correlation Summary
| Measurement | Immigrants from Cuba | Arab |
| Minimum | 65.5% | 45.6% |
| Maximum | 100.0% | 100.0% |
| Range | 34.5% | 54.4% |
| Mean | 84.5% | 82.2% |
| Median | 83.9% | 84.9% |
| Interquartile 25% (IQ1) | 81.4% | 79.5% |
| Interquartile 75% (IQ3) | 87.9% | 86.0% |
| Interquartile Range (IQR) | 6.5% | 6.5% |
| Standard Deviation (Sample) | 5.8% | 11.1% |
| Standard Deviation (Population) | 5.8% | 11.0% |
Demographics Similar to Immigrants from Cuba and Arabs by In Labor Force | Age 30-34
In terms of in labor force | age 30-34, the demographic groups most similar to Immigrants from Cuba are Immigrants from El Salvador (84.2%, a difference of 0.0%), Scottish (84.2%, a difference of 0.010%), Cuban (84.2%, a difference of 0.020%), Immigrants from Laos (84.2%, a difference of 0.030%), and Salvadoran (84.2%, a difference of 0.040%). Similarly, the demographic groups most similar to Arabs are Jamaican (84.3%, a difference of 0.0%), Indonesian (84.3%, a difference of 0.0%), Japanese (84.3%, a difference of 0.0%), Bangladeshi (84.3%, a difference of 0.010%), and Immigrants from Western Asia (84.3%, a difference of 0.010%).
| Demographics | Rating | Rank | In Labor Force | Age 30-34 |
| Bangladeshis | 9.4 /100 | #207 | Tragic 84.3% |
| Arabs | 8.9 /100 | #208 | Tragic 84.3% |
| Jamaicans | 8.8 /100 | #209 | Tragic 84.3% |
| Indonesians | 8.8 /100 | #210 | Tragic 84.3% |
| Japanese | 8.8 /100 | #211 | Tragic 84.3% |
| Immigrants | Western Asia | 8.2 /100 | #212 | Tragic 84.3% |
| Immigrants | Jamaica | 7.9 /100 | #213 | Tragic 84.3% |
| Immigrants | Germany | 7.2 /100 | #214 | Tragic 84.3% |
| Europeans | 7.2 /100 | #215 | Tragic 84.3% |
| Immigrants | Ecuador | 7.1 /100 | #216 | Tragic 84.3% |
| Immigrants | Trinidad and Tobago | 7.0 /100 | #217 | Tragic 84.3% |
| Immigrants | Panama | 6.3 /100 | #218 | Tragic 84.3% |
| Swiss | 5.8 /100 | #219 | Tragic 84.3% |
| Danes | 5.3 /100 | #220 | Tragic 84.3% |
| Salvadorans | 3.8 /100 | #221 | Tragic 84.2% |
| Panamanians | 3.8 /100 | #222 | Tragic 84.2% |
| Immigrants | Laos | 3.6 /100 | #223 | Tragic 84.2% |
| Cubans | 3.4 /100 | #224 | Tragic 84.2% |
| Scottish | 3.1 /100 | #225 | Tragic 84.2% |
| Immigrants | El Salvador | 3.0 /100 | #226 | Tragic 84.2% |
| Immigrants | Cuba | 3.0 /100 | #227 | Tragic 84.2% |