Sioux vs Chilean In Labor Force | Age 30-34
COMPARE
Sioux
Chilean
In Labor Force | Age 30-34
In Labor Force | Age 30-34 Comparison
Sioux
Chileans
80.4%
IN LABOR FORCE | AGE 30-34
0.0/ 100
METRIC RATING
328th/ 347
METRIC RANK
84.9%
IN LABOR FORCE | AGE 30-34
85.3/ 100
METRIC RATING
141st/ 347
METRIC RANK
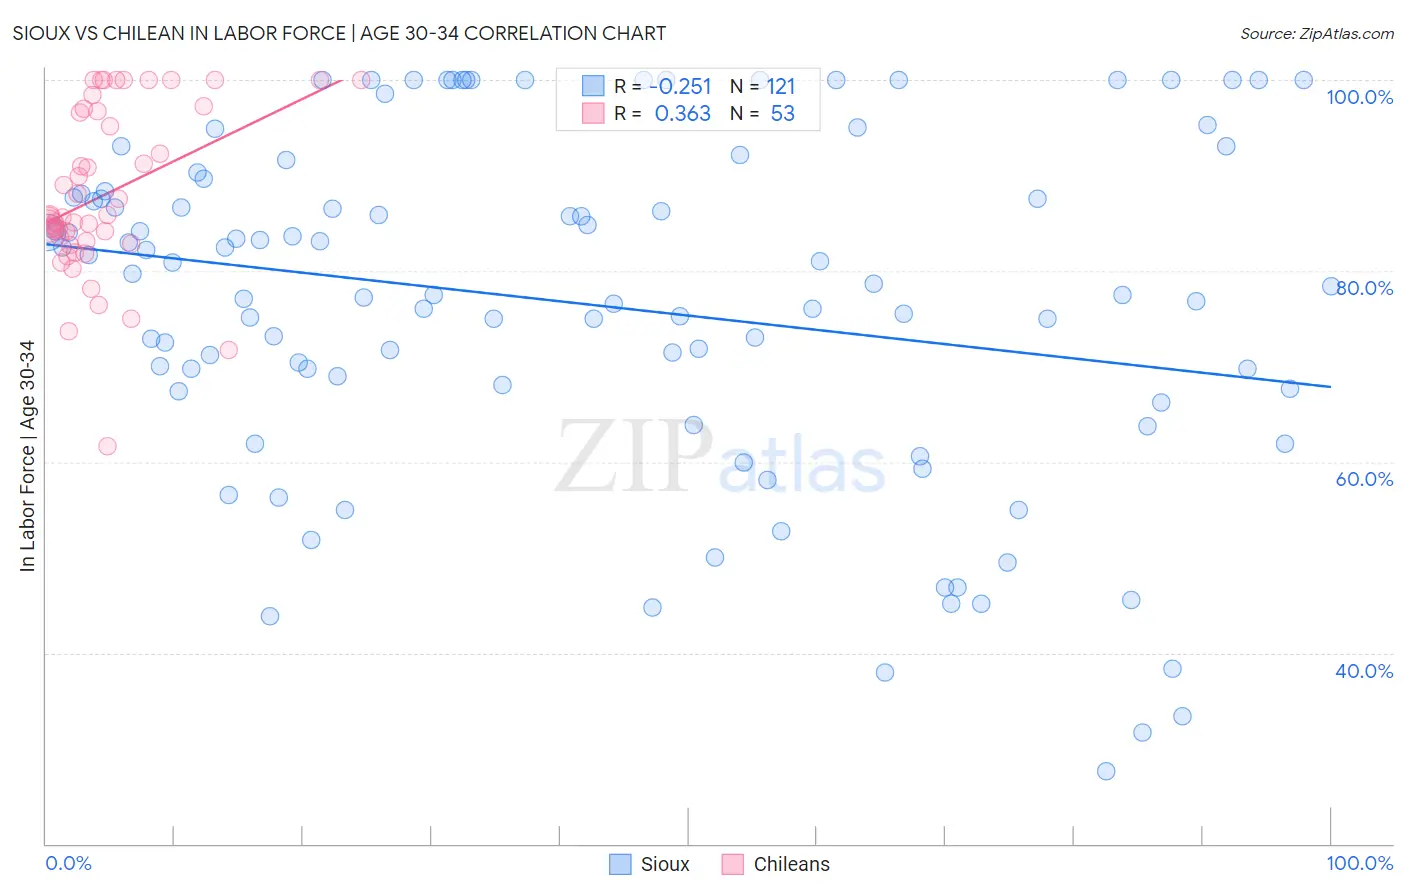
Sioux vs Chilean In Labor Force | Age 30-34 Correlation Chart
The statistical analysis conducted on geographies consisting of 234,072,286 people shows a weak negative correlation between the proportion of Sioux and labor force participation rate among population between the ages 30 and 34 in the United States with a correlation coefficient (R) of -0.251 and weighted average of 80.4%. Similarly, the statistical analysis conducted on geographies consisting of 256,589,082 people shows a mild positive correlation between the proportion of Chileans and labor force participation rate among population between the ages 30 and 34 in the United States with a correlation coefficient (R) of 0.363 and weighted average of 84.9%, a difference of 5.7%.
In Labor Force | Age 30-34 Correlation Summary
| Measurement | Sioux | Chilean |
| Minimum | 27.6% | 61.6% |
| Maximum | 100.0% | 100.0% |
| Range | 72.4% | 38.4% |
| Mean | 76.6% | 88.0% |
| Median | 78.4% | 85.6% |
| Interquartile 25% (IQ1) | 67.6% | 83.0% |
| Interquartile 75% (IQ3) | 88.2% | 96.8% |
| Interquartile Range (IQR) | 20.6% | 13.8% |
| Standard Deviation (Sample) | 17.9% | 8.8% |
| Standard Deviation (Population) | 17.8% | 8.7% |
Similar Demographics by In Labor Force | Age 30-34
Demographics Similar to Sioux by In Labor Force | Age 30-34
In terms of in labor force | age 30-34, the demographic groups most similar to Sioux are Creek (80.4%, a difference of 0.010%), Colville (80.7%, a difference of 0.41%), Pueblo (80.0%, a difference of 0.41%), Houma (79.9%, a difference of 0.58%), and Seminole (80.8%, a difference of 0.60%).
| Demographics | Rating | Rank | In Labor Force | Age 30-34 |
| Alaska Natives | 0.0 /100 | #321 | Tragic 81.3% |
| Puerto Ricans | 0.0 /100 | #322 | Tragic 81.2% |
| Paiute | 0.0 /100 | #323 | Tragic 81.2% |
| Cheyenne | 0.0 /100 | #324 | Tragic 81.1% |
| Dutch West Indians | 0.0 /100 | #325 | Tragic 81.0% |
| Seminole | 0.0 /100 | #326 | Tragic 80.8% |
| Colville | 0.0 /100 | #327 | Tragic 80.7% |
| Sioux | 0.0 /100 | #328 | Tragic 80.4% |
| Creek | 0.0 /100 | #329 | Tragic 80.4% |
| Pueblo | 0.0 /100 | #330 | Tragic 80.0% |
| Houma | 0.0 /100 | #331 | Tragic 79.9% |
| Kiowa | 0.0 /100 | #332 | Tragic 79.8% |
| Inupiat | 0.0 /100 | #333 | Tragic 79.7% |
| Hopi | 0.0 /100 | #334 | Tragic 79.3% |
| Marshallese | 0.0 /100 | #335 | Tragic 79.2% |
Demographics Similar to Chileans by In Labor Force | Age 30-34
In terms of in labor force | age 30-34, the demographic groups most similar to Chileans are Immigrants from Indonesia (84.9%, a difference of 0.010%), Immigrants from Vietnam (85.0%, a difference of 0.020%), Bhutanese (85.0%, a difference of 0.030%), South African (85.0%, a difference of 0.040%), and Sri Lankan (85.0%, a difference of 0.040%).
| Demographics | Rating | Rank | In Labor Force | Age 30-34 |
| Immigrants | Chile | 89.2 /100 | #134 | Excellent 85.0% |
| Immigrants | Asia | 88.9 /100 | #135 | Excellent 85.0% |
| Jordanians | 88.6 /100 | #136 | Excellent 85.0% |
| South Africans | 88.0 /100 | #137 | Excellent 85.0% |
| Sri Lankans | 87.8 /100 | #138 | Excellent 85.0% |
| Bhutanese | 87.5 /100 | #139 | Excellent 85.0% |
| Immigrants | Vietnam | 86.5 /100 | #140 | Excellent 85.0% |
| Chileans | 85.3 /100 | #141 | Excellent 84.9% |
| Immigrants | Indonesia | 84.3 /100 | #142 | Excellent 84.9% |
| Colombians | 82.2 /100 | #143 | Excellent 84.9% |
| Uruguayans | 78.5 /100 | #144 | Good 84.9% |
| Palestinians | 77.7 /100 | #145 | Good 84.9% |
| Immigrants | Saudi Arabia | 76.6 /100 | #146 | Good 84.9% |
| Immigrants | Colombia | 76.3 /100 | #147 | Good 84.9% |
| Immigrants | Pakistan | 76.2 /100 | #148 | Good 84.9% |