Sioux vs Immigrants from Caribbean In Labor Force | Age 30-34
COMPARE
Sioux
Immigrants from Caribbean
In Labor Force | Age 30-34
In Labor Force | Age 30-34 Comparison
Sioux
Immigrants from Caribbean
80.4%
IN LABOR FORCE | AGE 30-34
0.0/ 100
METRIC RATING
328th/ 347
METRIC RANK
84.0%
IN LABOR FORCE | AGE 30-34
1.1/ 100
METRIC RATING
243rd/ 347
METRIC RANK
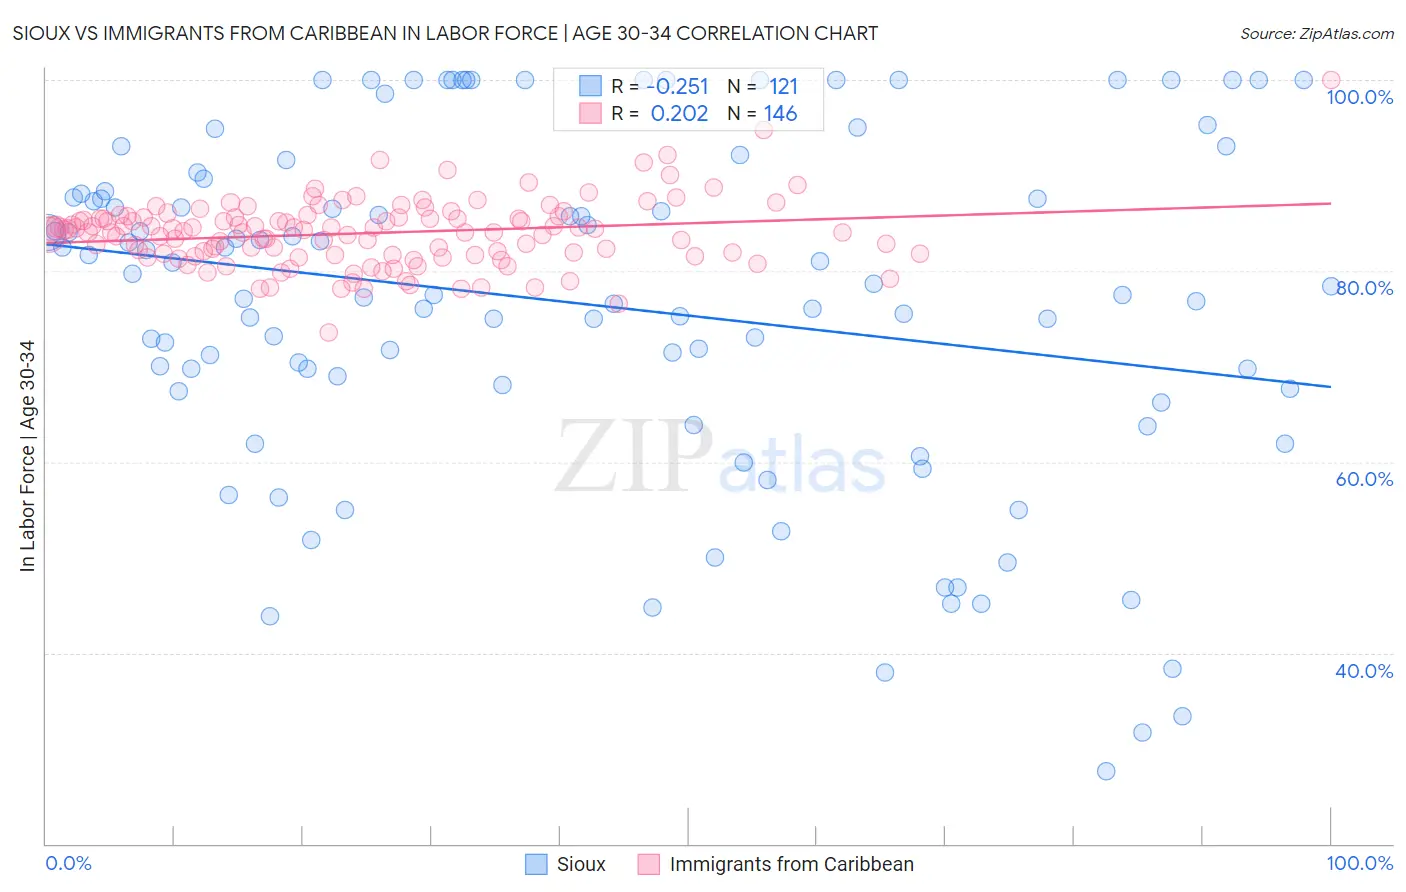
Sioux vs Immigrants from Caribbean In Labor Force | Age 30-34 Correlation Chart
The statistical analysis conducted on geographies consisting of 234,072,286 people shows a weak negative correlation between the proportion of Sioux and labor force participation rate among population between the ages 30 and 34 in the United States with a correlation coefficient (R) of -0.251 and weighted average of 80.4%. Similarly, the statistical analysis conducted on geographies consisting of 449,684,451 people shows a weak positive correlation between the proportion of Immigrants from Caribbean and labor force participation rate among population between the ages 30 and 34 in the United States with a correlation coefficient (R) of 0.202 and weighted average of 84.0%, a difference of 4.5%.
In Labor Force | Age 30-34 Correlation Summary
| Measurement | Sioux | Immigrants from Caribbean |
| Minimum | 27.6% | 73.6% |
| Maximum | 100.0% | 100.0% |
| Range | 72.4% | 26.4% |
| Mean | 76.6% | 84.0% |
| Median | 78.4% | 84.2% |
| Interquartile 25% (IQ1) | 67.6% | 81.6% |
| Interquartile 75% (IQ3) | 88.2% | 85.6% |
| Interquartile Range (IQR) | 20.6% | 4.0% |
| Standard Deviation (Sample) | 17.9% | 3.5% |
| Standard Deviation (Population) | 17.8% | 3.5% |
Similar Demographics by In Labor Force | Age 30-34
Demographics Similar to Sioux by In Labor Force | Age 30-34
In terms of in labor force | age 30-34, the demographic groups most similar to Sioux are Creek (80.4%, a difference of 0.010%), Colville (80.7%, a difference of 0.41%), Pueblo (80.0%, a difference of 0.41%), Houma (79.9%, a difference of 0.58%), and Seminole (80.8%, a difference of 0.60%).
| Demographics | Rating | Rank | In Labor Force | Age 30-34 |
| Alaska Natives | 0.0 /100 | #321 | Tragic 81.3% |
| Puerto Ricans | 0.0 /100 | #322 | Tragic 81.2% |
| Paiute | 0.0 /100 | #323 | Tragic 81.2% |
| Cheyenne | 0.0 /100 | #324 | Tragic 81.1% |
| Dutch West Indians | 0.0 /100 | #325 | Tragic 81.0% |
| Seminole | 0.0 /100 | #326 | Tragic 80.8% |
| Colville | 0.0 /100 | #327 | Tragic 80.7% |
| Sioux | 0.0 /100 | #328 | Tragic 80.4% |
| Creek | 0.0 /100 | #329 | Tragic 80.4% |
| Pueblo | 0.0 /100 | #330 | Tragic 80.0% |
| Houma | 0.0 /100 | #331 | Tragic 79.9% |
| Kiowa | 0.0 /100 | #332 | Tragic 79.8% |
| Inupiat | 0.0 /100 | #333 | Tragic 79.7% |
| Hopi | 0.0 /100 | #334 | Tragic 79.3% |
| Marshallese | 0.0 /100 | #335 | Tragic 79.2% |
Demographics Similar to Immigrants from Caribbean by In Labor Force | Age 30-34
In terms of in labor force | age 30-34, the demographic groups most similar to Immigrants from Caribbean are Immigrants from Oceania (84.0%, a difference of 0.010%), Immigrants from Portugal (84.0%, a difference of 0.020%), Basque (84.0%, a difference of 0.030%), Immigrants from Venezuela (84.0%, a difference of 0.030%), and Central American (84.0%, a difference of 0.030%).
| Demographics | Rating | Rank | In Labor Force | Age 30-34 |
| U.S. Virgin Islanders | 1.5 /100 | #236 | Tragic 84.1% |
| Celtics | 1.4 /100 | #237 | Tragic 84.1% |
| Immigrants | Barbados | 1.4 /100 | #238 | Tragic 84.0% |
| English | 1.4 /100 | #239 | Tragic 84.0% |
| Venezuelans | 1.3 /100 | #240 | Tragic 84.0% |
| Immigrants | Portugal | 1.2 /100 | #241 | Tragic 84.0% |
| Immigrants | Oceania | 1.1 /100 | #242 | Tragic 84.0% |
| Immigrants | Caribbean | 1.1 /100 | #243 | Tragic 84.0% |
| Basques | 0.9 /100 | #244 | Tragic 84.0% |
| Immigrants | Venezuela | 0.9 /100 | #245 | Tragic 84.0% |
| Central Americans | 0.9 /100 | #246 | Tragic 84.0% |
| British West Indians | 0.8 /100 | #247 | Tragic 84.0% |
| Portuguese | 0.8 /100 | #248 | Tragic 84.0% |
| Immigrants | Dominica | 0.7 /100 | #249 | Tragic 84.0% |
| Immigrants | Iraq | 0.7 /100 | #250 | Tragic 83.9% |