Sioux vs Immigrants from India In Labor Force | Age 30-34
COMPARE
Sioux
Immigrants from India
In Labor Force | Age 30-34
In Labor Force | Age 30-34 Comparison
Sioux
Immigrants from India
80.4%
IN LABOR FORCE | AGE 30-34
0.0/ 100
METRIC RATING
328th/ 347
METRIC RANK
85.2%
IN LABOR FORCE | AGE 30-34
97.4/ 100
METRIC RATING
95th/ 347
METRIC RANK
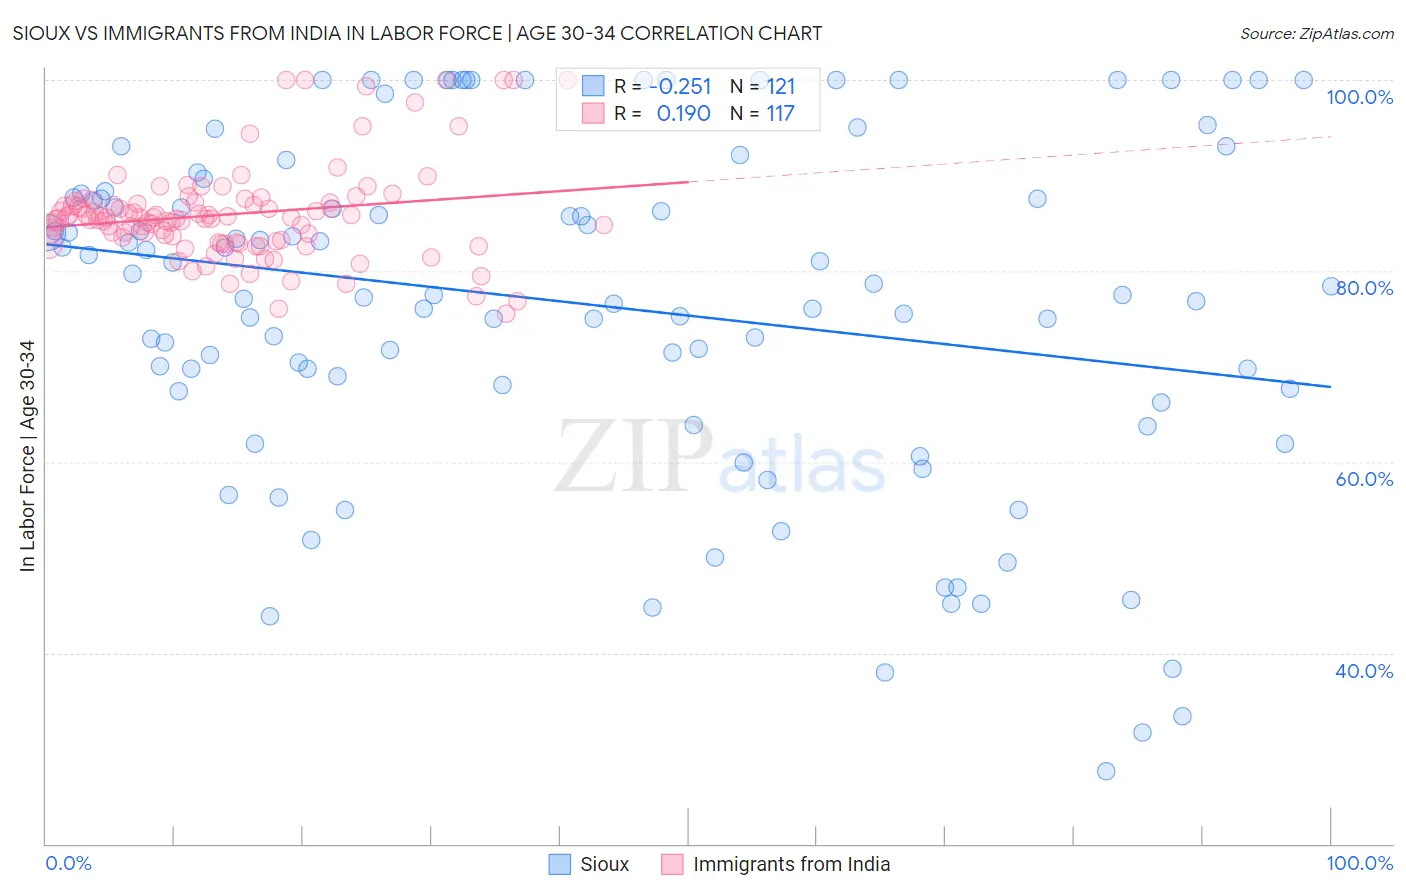
Sioux vs Immigrants from India In Labor Force | Age 30-34 Correlation Chart
The statistical analysis conducted on geographies consisting of 234,072,286 people shows a weak negative correlation between the proportion of Sioux and labor force participation rate among population between the ages 30 and 34 in the United States with a correlation coefficient (R) of -0.251 and weighted average of 80.4%. Similarly, the statistical analysis conducted on geographies consisting of 433,763,209 people shows a poor positive correlation between the proportion of Immigrants from India and labor force participation rate among population between the ages 30 and 34 in the United States with a correlation coefficient (R) of 0.190 and weighted average of 85.2%, a difference of 6.0%.
In Labor Force | Age 30-34 Correlation Summary
| Measurement | Sioux | Immigrants from India |
| Minimum | 27.6% | 75.5% |
| Maximum | 100.0% | 100.0% |
| Range | 72.4% | 24.5% |
| Mean | 76.6% | 85.9% |
| Median | 78.4% | 85.5% |
| Interquartile 25% (IQ1) | 67.6% | 83.1% |
| Interquartile 75% (IQ3) | 88.2% | 87.2% |
| Interquartile Range (IQR) | 20.6% | 4.1% |
| Standard Deviation (Sample) | 17.9% | 5.0% |
| Standard Deviation (Population) | 17.8% | 5.0% |
Similar Demographics by In Labor Force | Age 30-34
Demographics Similar to Sioux by In Labor Force | Age 30-34
In terms of in labor force | age 30-34, the demographic groups most similar to Sioux are Creek (80.4%, a difference of 0.010%), Colville (80.7%, a difference of 0.41%), Pueblo (80.0%, a difference of 0.41%), Houma (79.9%, a difference of 0.58%), and Seminole (80.8%, a difference of 0.60%).
| Demographics | Rating | Rank | In Labor Force | Age 30-34 |
| Alaska Natives | 0.0 /100 | #321 | Tragic 81.3% |
| Puerto Ricans | 0.0 /100 | #322 | Tragic 81.2% |
| Paiute | 0.0 /100 | #323 | Tragic 81.2% |
| Cheyenne | 0.0 /100 | #324 | Tragic 81.1% |
| Dutch West Indians | 0.0 /100 | #325 | Tragic 81.0% |
| Seminole | 0.0 /100 | #326 | Tragic 80.8% |
| Colville | 0.0 /100 | #327 | Tragic 80.7% |
| Sioux | 0.0 /100 | #328 | Tragic 80.4% |
| Creek | 0.0 /100 | #329 | Tragic 80.4% |
| Pueblo | 0.0 /100 | #330 | Tragic 80.0% |
| Houma | 0.0 /100 | #331 | Tragic 79.9% |
| Kiowa | 0.0 /100 | #332 | Tragic 79.8% |
| Inupiat | 0.0 /100 | #333 | Tragic 79.7% |
| Hopi | 0.0 /100 | #334 | Tragic 79.3% |
| Marshallese | 0.0 /100 | #335 | Tragic 79.2% |
Demographics Similar to Immigrants from India by In Labor Force | Age 30-34
In terms of in labor force | age 30-34, the demographic groups most similar to Immigrants from India are Swedish (85.2%, a difference of 0.0%), Immigrants from Norway (85.2%, a difference of 0.010%), Immigrants from Korea (85.2%, a difference of 0.010%), Thai (85.2%, a difference of 0.010%), and German Russian (85.2%, a difference of 0.020%).
| Demographics | Rating | Rank | In Labor Force | Age 30-34 |
| Immigrants | Belgium | 98.2 /100 | #88 | Exceptional 85.3% |
| Immigrants | Kazakhstan | 98.1 /100 | #89 | Exceptional 85.3% |
| Burmese | 97.9 /100 | #90 | Exceptional 85.3% |
| Immigrants | Moldova | 97.9 /100 | #91 | Exceptional 85.3% |
| German Russians | 97.7 /100 | #92 | Exceptional 85.2% |
| Immigrants | Norway | 97.6 /100 | #93 | Exceptional 85.2% |
| Swedes | 97.5 /100 | #94 | Exceptional 85.2% |
| Immigrants | India | 97.4 /100 | #95 | Exceptional 85.2% |
| Immigrants | Korea | 97.3 /100 | #96 | Exceptional 85.2% |
| Thais | 97.2 /100 | #97 | Exceptional 85.2% |
| Immigrants | Uganda | 97.2 /100 | #98 | Exceptional 85.2% |
| Belgians | 97.2 /100 | #99 | Exceptional 85.2% |
| Sudanese | 97.1 /100 | #100 | Exceptional 85.2% |
| Immigrants | Belarus | 96.9 /100 | #101 | Exceptional 85.2% |
| Immigrants | Austria | 96.8 /100 | #102 | Exceptional 85.2% |