Sioux vs Immigrants from Western Europe In Labor Force | Age 30-34
COMPARE
Sioux
Immigrants from Western Europe
In Labor Force | Age 30-34
In Labor Force | Age 30-34 Comparison
Sioux
Immigrants from Western Europe
80.4%
IN LABOR FORCE | AGE 30-34
0.0/ 100
METRIC RATING
328th/ 347
METRIC RANK
84.7%
IN LABOR FORCE | AGE 30-34
56.7/ 100
METRIC RATING
165th/ 347
METRIC RANK
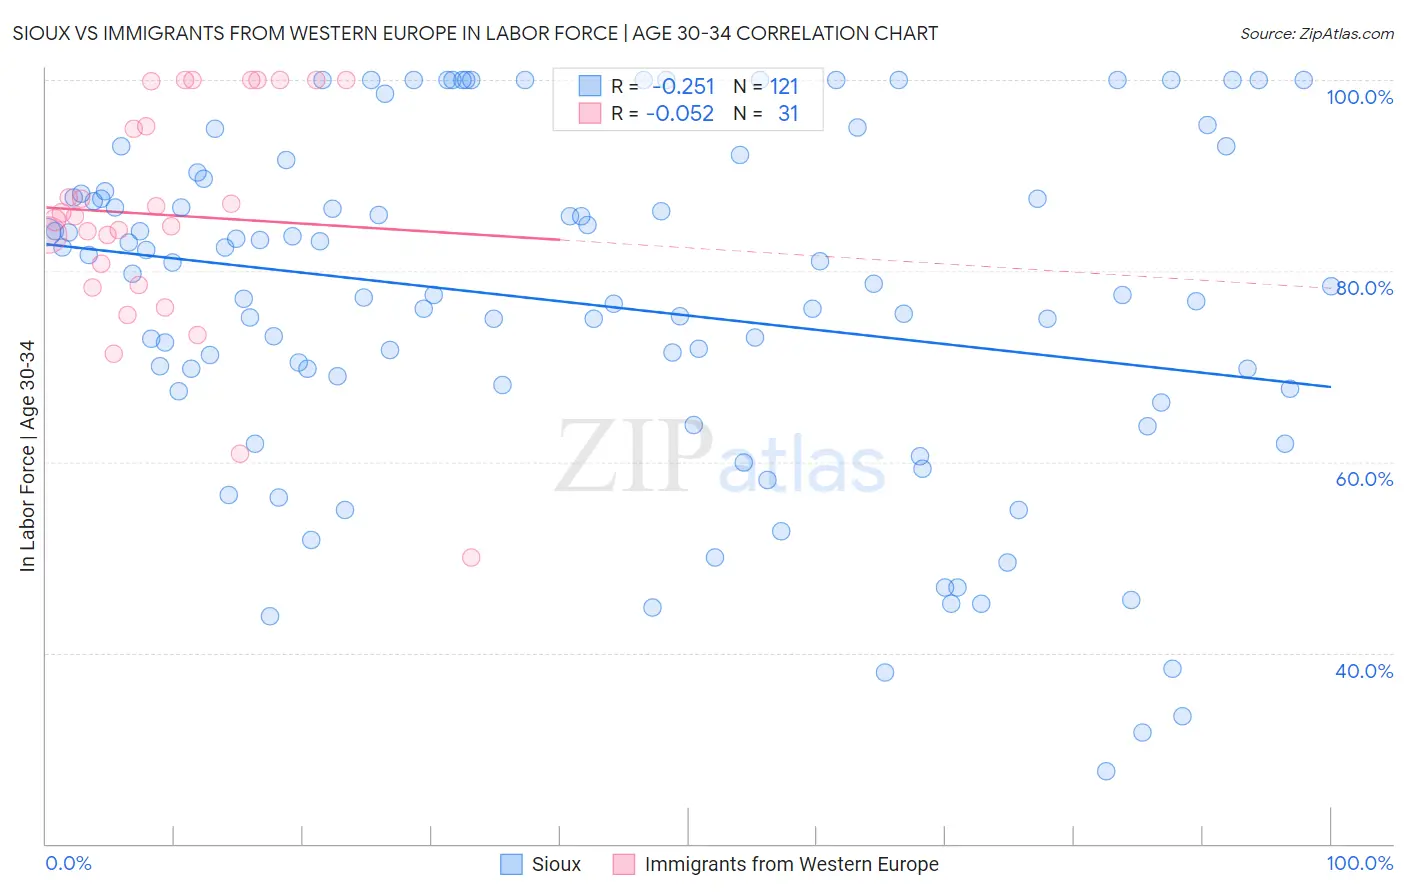
Sioux vs Immigrants from Western Europe In Labor Force | Age 30-34 Correlation Chart
The statistical analysis conducted on geographies consisting of 234,072,286 people shows a weak negative correlation between the proportion of Sioux and labor force participation rate among population between the ages 30 and 34 in the United States with a correlation coefficient (R) of -0.251 and weighted average of 80.4%. Similarly, the statistical analysis conducted on geographies consisting of 493,628,836 people shows a slight negative correlation between the proportion of Immigrants from Western Europe and labor force participation rate among population between the ages 30 and 34 in the United States with a correlation coefficient (R) of -0.052 and weighted average of 84.7%, a difference of 5.4%.
In Labor Force | Age 30-34 Correlation Summary
| Measurement | Sioux | Immigrants from Western Europe |
| Minimum | 27.6% | 50.0% |
| Maximum | 100.0% | 100.0% |
| Range | 72.4% | 50.0% |
| Mean | 76.6% | 85.9% |
| Median | 78.4% | 85.7% |
| Interquartile 25% (IQ1) | 67.6% | 78.5% |
| Interquartile 75% (IQ3) | 88.2% | 99.9% |
| Interquartile Range (IQR) | 20.6% | 21.3% |
| Standard Deviation (Sample) | 17.9% | 12.1% |
| Standard Deviation (Population) | 17.8% | 11.9% |
Similar Demographics by In Labor Force | Age 30-34
Demographics Similar to Sioux by In Labor Force | Age 30-34
In terms of in labor force | age 30-34, the demographic groups most similar to Sioux are Creek (80.4%, a difference of 0.010%), Colville (80.7%, a difference of 0.41%), Pueblo (80.0%, a difference of 0.41%), Houma (79.9%, a difference of 0.58%), and Seminole (80.8%, a difference of 0.60%).
| Demographics | Rating | Rank | In Labor Force | Age 30-34 |
| Alaska Natives | 0.0 /100 | #321 | Tragic 81.3% |
| Puerto Ricans | 0.0 /100 | #322 | Tragic 81.2% |
| Paiute | 0.0 /100 | #323 | Tragic 81.2% |
| Cheyenne | 0.0 /100 | #324 | Tragic 81.1% |
| Dutch West Indians | 0.0 /100 | #325 | Tragic 81.0% |
| Seminole | 0.0 /100 | #326 | Tragic 80.8% |
| Colville | 0.0 /100 | #327 | Tragic 80.7% |
| Sioux | 0.0 /100 | #328 | Tragic 80.4% |
| Creek | 0.0 /100 | #329 | Tragic 80.4% |
| Pueblo | 0.0 /100 | #330 | Tragic 80.0% |
| Houma | 0.0 /100 | #331 | Tragic 79.9% |
| Kiowa | 0.0 /100 | #332 | Tragic 79.8% |
| Inupiat | 0.0 /100 | #333 | Tragic 79.7% |
| Hopi | 0.0 /100 | #334 | Tragic 79.3% |
| Marshallese | 0.0 /100 | #335 | Tragic 79.2% |
Demographics Similar to Immigrants from Western Europe by In Labor Force | Age 30-34
In terms of in labor force | age 30-34, the demographic groups most similar to Immigrants from Western Europe are Icelander (84.7%, a difference of 0.0%), South American (84.7%, a difference of 0.010%), Immigrants from Uruguay (84.7%, a difference of 0.010%), Afghan (84.7%, a difference of 0.010%), and Immigrants from South Eastern Asia (84.7%, a difference of 0.020%).
| Demographics | Rating | Rank | In Labor Force | Age 30-34 |
| Immigrants | Armenia | 64.7 /100 | #158 | Good 84.8% |
| Czechoslovakians | 63.0 /100 | #159 | Good 84.8% |
| Pakistanis | 60.8 /100 | #160 | Good 84.7% |
| Immigrants | Cambodia | 60.7 /100 | #161 | Good 84.7% |
| South Americans | 58.7 /100 | #162 | Average 84.7% |
| Immigrants | Uruguay | 57.4 /100 | #163 | Average 84.7% |
| Icelanders | 56.8 /100 | #164 | Average 84.7% |
| Immigrants | Western Europe | 56.7 /100 | #165 | Average 84.7% |
| Afghans | 55.2 /100 | #166 | Average 84.7% |
| Immigrants | South Eastern Asia | 54.2 /100 | #167 | Average 84.7% |
| Immigrants | Peru | 52.4 /100 | #168 | Average 84.7% |
| South American Indians | 52.1 /100 | #169 | Average 84.7% |
| Immigrants | Burma/Myanmar | 52.0 /100 | #170 | Average 84.7% |
| Irish | 52.0 /100 | #171 | Average 84.7% |
| Immigrants | England | 51.7 /100 | #172 | Average 84.7% |