Shoshone vs Immigrants from Northern Europe In Labor Force | Age > 16
COMPARE
Shoshone
Immigrants from Northern Europe
In Labor Force | Age > 16
In Labor Force | Age > 16 Comparison
Shoshone
Immigrants from Northern Europe
63.2%
IN LABOR FORCE | AGE > 16
0.0/ 100
METRIC RATING
310th/ 347
METRIC RANK
64.7%
IN LABOR FORCE | AGE > 16
7.2/ 100
METRIC RATING
231st/ 347
METRIC RANK
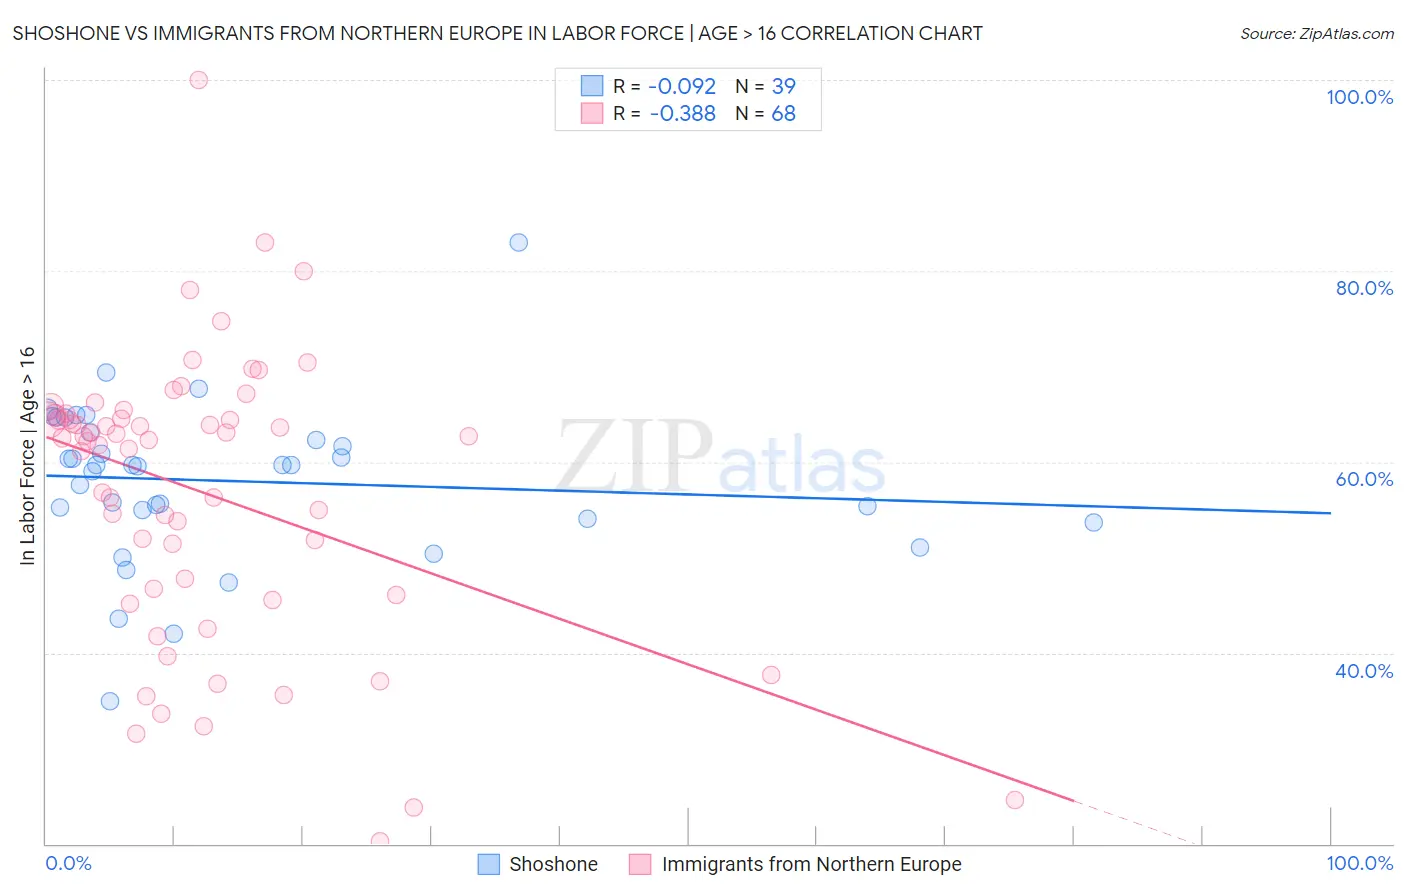
Shoshone vs Immigrants from Northern Europe In Labor Force | Age > 16 Correlation Chart
The statistical analysis conducted on geographies consisting of 66,627,221 people shows a slight negative correlation between the proportion of Shoshone and labor force participation rate among population ages 16 and over in the United States with a correlation coefficient (R) of -0.092 and weighted average of 63.2%. Similarly, the statistical analysis conducted on geographies consisting of 477,244,389 people shows a mild negative correlation between the proportion of Immigrants from Northern Europe and labor force participation rate among population ages 16 and over in the United States with a correlation coefficient (R) of -0.388 and weighted average of 64.7%, a difference of 2.2%.
In Labor Force | Age > 16 Correlation Summary
| Measurement | Shoshone | Immigrants from Northern Europe |
| Minimum | 34.9% | 20.3% |
| Maximum | 83.0% | 100.0% |
| Range | 48.1% | 79.7% |
| Mean | 58.0% | 56.8% |
| Median | 59.7% | 62.4% |
| Interquartile 25% (IQ1) | 54.0% | 46.4% |
| Interquartile 75% (IQ3) | 63.1% | 64.7% |
| Interquartile Range (IQR) | 9.1% | 18.3% |
| Standard Deviation (Sample) | 8.4% | 14.9% |
| Standard Deviation (Population) | 8.3% | 14.8% |
Similar Demographics by In Labor Force | Age > 16
Demographics Similar to Shoshone by In Labor Force | Age > 16
In terms of in labor force | age > 16, the demographic groups most similar to Shoshone are Blackfeet (63.2%, a difference of 0.010%), Scotch-Irish (63.3%, a difference of 0.070%), Iroquois (63.2%, a difference of 0.070%), Pennsylvania German (63.4%, a difference of 0.20%), and Chippewa (63.1%, a difference of 0.20%).
| Demographics | Rating | Rank | In Labor Force | Age > 16 |
| Cree | 0.0 /100 | #303 | Tragic 63.5% |
| Immigrants | Nonimmigrants | 0.0 /100 | #304 | Tragic 63.5% |
| Osage | 0.0 /100 | #305 | Tragic 63.5% |
| Blacks/African Americans | 0.0 /100 | #306 | Tragic 63.4% |
| Central American Indians | 0.0 /100 | #307 | Tragic 63.4% |
| Pennsylvania Germans | 0.0 /100 | #308 | Tragic 63.4% |
| Scotch-Irish | 0.0 /100 | #309 | Tragic 63.3% |
| Shoshone | 0.0 /100 | #310 | Tragic 63.2% |
| Blackfeet | 0.0 /100 | #311 | Tragic 63.2% |
| Iroquois | 0.0 /100 | #312 | Tragic 63.2% |
| Chippewa | 0.0 /100 | #313 | Tragic 63.1% |
| Yaqui | 0.0 /100 | #314 | Tragic 63.0% |
| Potawatomi | 0.0 /100 | #315 | Tragic 62.8% |
| Yup'ik | 0.0 /100 | #316 | Tragic 62.7% |
| Kiowa | 0.0 /100 | #317 | Tragic 62.4% |
Demographics Similar to Immigrants from Northern Europe by In Labor Force | Age > 16
In terms of in labor force | age > 16, the demographic groups most similar to Immigrants from Northern Europe are British (64.7%, a difference of 0.0%), Chinese (64.7%, a difference of 0.0%), European (64.7%, a difference of 0.040%), Polish (64.7%, a difference of 0.040%), and Northern European (64.7%, a difference of 0.040%).
| Demographics | Rating | Rank | In Labor Force | Age > 16 |
| Immigrants | Jamaica | 8.8 /100 | #224 | Tragic 64.7% |
| Croatians | 8.8 /100 | #225 | Tragic 64.7% |
| Europeans | 8.3 /100 | #226 | Tragic 64.7% |
| Poles | 8.3 /100 | #227 | Tragic 64.7% |
| Northern Europeans | 8.2 /100 | #228 | Tragic 64.7% |
| British | 7.3 /100 | #229 | Tragic 64.7% |
| Chinese | 7.3 /100 | #230 | Tragic 64.7% |
| Immigrants | Northern Europe | 7.2 /100 | #231 | Tragic 64.7% |
| Africans | 5.8 /100 | #232 | Tragic 64.6% |
| Slavs | 4.9 /100 | #233 | Tragic 64.6% |
| Vietnamese | 4.7 /100 | #234 | Tragic 64.6% |
| Austrians | 4.6 /100 | #235 | Tragic 64.6% |
| Immigrants | Norway | 4.6 /100 | #236 | Tragic 64.6% |
| Italians | 4.6 /100 | #237 | Tragic 64.6% |
| Lebanese | 3.9 /100 | #238 | Tragic 64.5% |