Hmong vs Mongolian In Labor Force | Age > 16
COMPARE
Hmong
Mongolian
In Labor Force | Age > 16
In Labor Force | Age > 16 Comparison
Hmong
Mongolians
64.1%
IN LABOR FORCE | AGE > 16
0.3/ 100
METRIC RATING
273rd/ 347
METRIC RANK
66.1%
IN LABOR FORCE | AGE > 16
99.4/ 100
METRIC RATING
85th/ 347
METRIC RANK
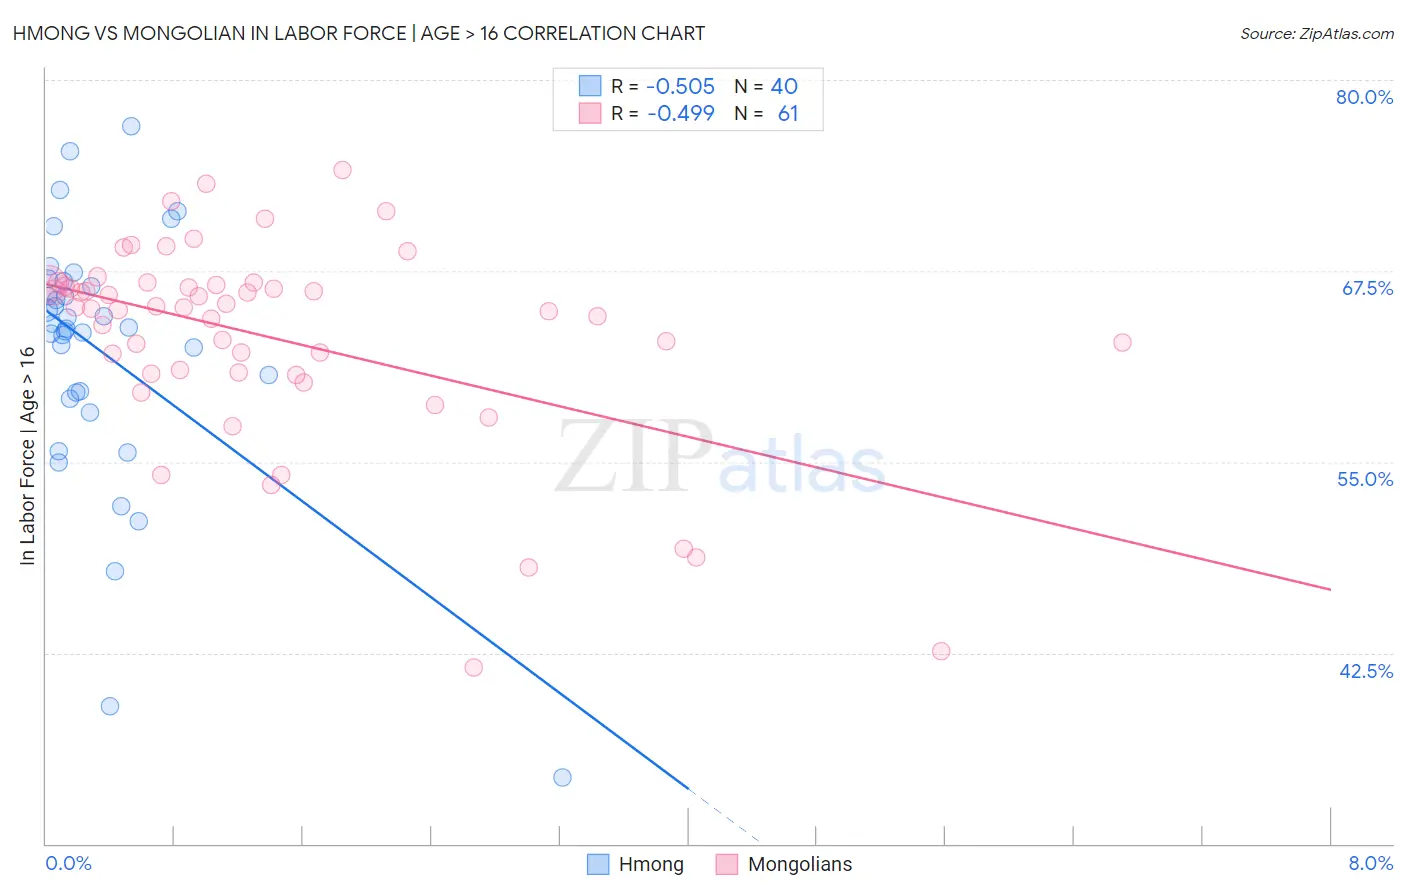
Hmong vs Mongolian In Labor Force | Age > 16 Correlation Chart
The statistical analysis conducted on geographies consisting of 24,681,537 people shows a substantial negative correlation between the proportion of Hmong and labor force participation rate among population ages 16 and over in the United States with a correlation coefficient (R) of -0.505 and weighted average of 64.1%. Similarly, the statistical analysis conducted on geographies consisting of 140,362,004 people shows a moderate negative correlation between the proportion of Mongolians and labor force participation rate among population ages 16 and over in the United States with a correlation coefficient (R) of -0.499 and weighted average of 66.1%, a difference of 3.1%.
In Labor Force | Age > 16 Correlation Summary
| Measurement | Hmong | Mongolian |
| Minimum | 34.3% | 41.5% |
| Maximum | 77.0% | 74.1% |
| Range | 42.7% | 32.6% |
| Mean | 62.2% | 63.1% |
| Median | 63.7% | 65.1% |
| Interquartile 25% (IQ1) | 59.3% | 60.8% |
| Interquartile 75% (IQ3) | 66.7% | 66.6% |
| Interquartile Range (IQR) | 7.3% | 5.8% |
| Standard Deviation (Sample) | 8.6% | 6.7% |
| Standard Deviation (Population) | 8.5% | 6.7% |
Similar Demographics by In Labor Force | Age > 16
Demographics Similar to Hmong by In Labor Force | Age > 16
In terms of in labor force | age > 16, the demographic groups most similar to Hmong are Native Hawaiian (64.1%, a difference of 0.0%), Immigrants from Cuba (64.1%, a difference of 0.020%), Mexican (64.1%, a difference of 0.020%), French American Indian (64.1%, a difference of 0.020%), and Guyanese (64.1%, a difference of 0.030%).
| Demographics | Rating | Rank | In Labor Force | Age > 16 |
| Immigrants | England | 0.5 /100 | #266 | Tragic 64.2% |
| Canadians | 0.5 /100 | #267 | Tragic 64.1% |
| Spaniards | 0.5 /100 | #268 | Tragic 64.1% |
| Irish | 0.4 /100 | #269 | Tragic 64.1% |
| Guyanese | 0.4 /100 | #270 | Tragic 64.1% |
| Dominicans | 0.4 /100 | #271 | Tragic 64.1% |
| Native Hawaiians | 0.3 /100 | #272 | Tragic 64.1% |
| Hmong | 0.3 /100 | #273 | Tragic 64.1% |
| Immigrants | Cuba | 0.3 /100 | #274 | Tragic 64.1% |
| Mexicans | 0.3 /100 | #275 | Tragic 64.1% |
| French American Indians | 0.3 /100 | #276 | Tragic 64.1% |
| Immigrants | Bahamas | 0.3 /100 | #277 | Tragic 64.0% |
| Assyrians/Chaldeans/Syriacs | 0.3 /100 | #278 | Tragic 64.0% |
| Welsh | 0.2 /100 | #279 | Tragic 64.0% |
| Immigrants | St. Vincent and the Grenadines | 0.2 /100 | #280 | Tragic 64.0% |
Demographics Similar to Mongolians by In Labor Force | Age > 16
In terms of in labor force | age > 16, the demographic groups most similar to Mongolians are German Russian (66.1%, a difference of 0.020%), Immigrants from Jordan (66.1%, a difference of 0.020%), Central American (66.1%, a difference of 0.020%), South American (66.0%, a difference of 0.020%), and South American Indian (66.0%, a difference of 0.020%).
| Demographics | Rating | Rank | In Labor Force | Age > 16 |
| Immigrants | Asia | 99.6 /100 | #78 | Exceptional 66.1% |
| Turks | 99.6 /100 | #79 | Exceptional 66.1% |
| Malaysians | 99.6 /100 | #80 | Exceptional 66.1% |
| Moroccans | 99.5 /100 | #81 | Exceptional 66.1% |
| German Russians | 99.4 /100 | #82 | Exceptional 66.1% |
| Immigrants | Jordan | 99.4 /100 | #83 | Exceptional 66.1% |
| Central Americans | 99.4 /100 | #84 | Exceptional 66.1% |
| Mongolians | 99.4 /100 | #85 | Exceptional 66.1% |
| South Americans | 99.4 /100 | #86 | Exceptional 66.0% |
| South American Indians | 99.4 /100 | #87 | Exceptional 66.0% |
| Bermudans | 99.3 /100 | #88 | Exceptional 66.0% |
| Immigrants | Laos | 99.2 /100 | #89 | Exceptional 66.0% |
| Chileans | 99.2 /100 | #90 | Exceptional 66.0% |
| Iranians | 99.2 /100 | #91 | Exceptional 66.0% |
| Aleuts | 99.1 /100 | #92 | Exceptional 66.0% |