Shoshone vs Immigrants from Israel In Labor Force | Age > 16
COMPARE
Shoshone
Immigrants from Israel
In Labor Force | Age > 16
In Labor Force | Age > 16 Comparison
Shoshone
Immigrants from Israel
63.2%
IN LABOR FORCE | AGE > 16
0.0/ 100
METRIC RATING
310th/ 347
METRIC RANK
65.2%
IN LABOR FORCE | AGE > 16
61.7/ 100
METRIC RATING
170th/ 347
METRIC RANK
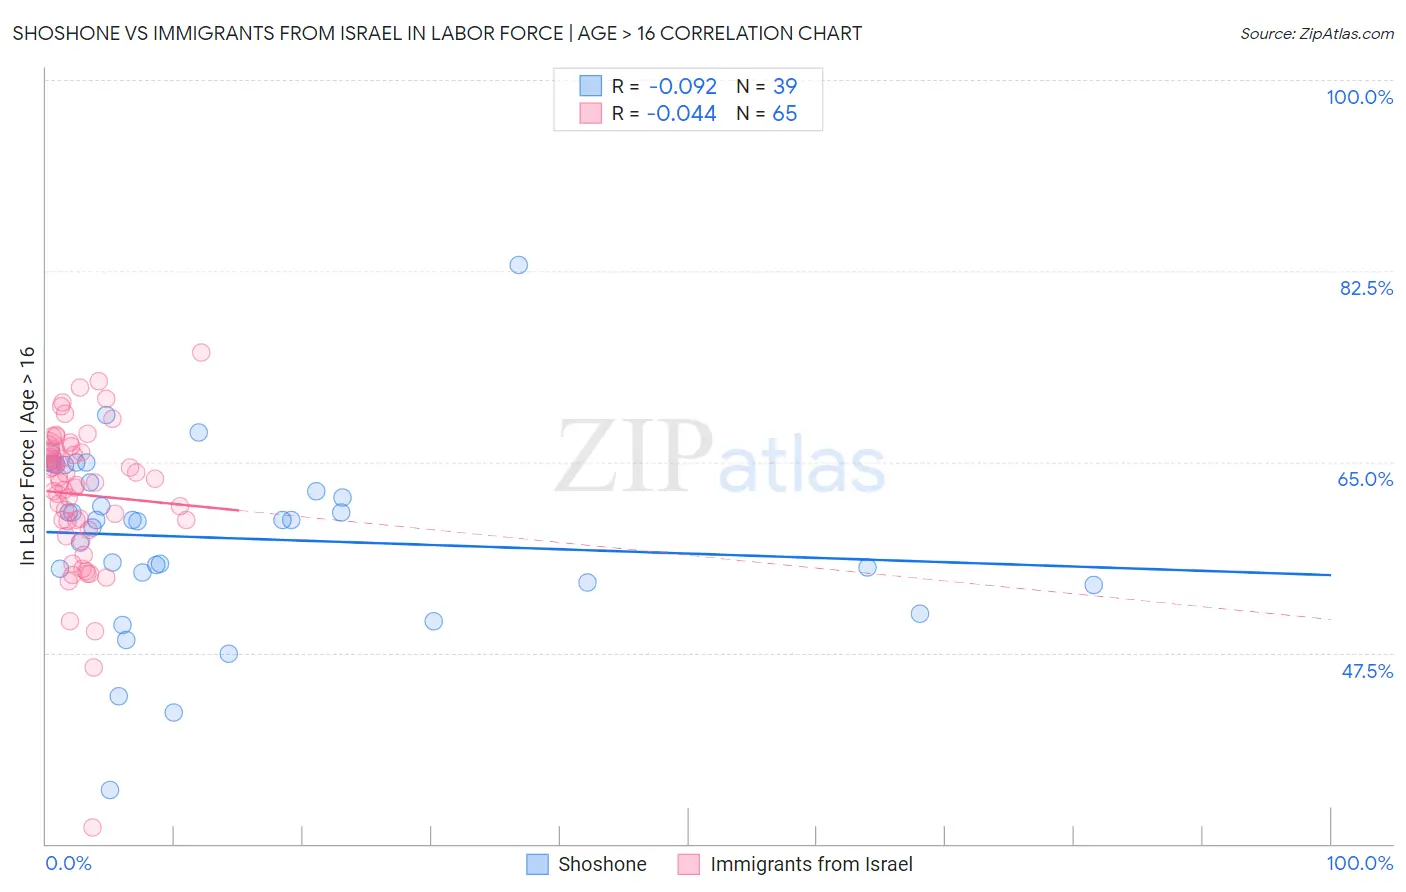
Shoshone vs Immigrants from Israel In Labor Force | Age > 16 Correlation Chart
The statistical analysis conducted on geographies consisting of 66,627,221 people shows a slight negative correlation between the proportion of Shoshone and labor force participation rate among population ages 16 and over in the United States with a correlation coefficient (R) of -0.092 and weighted average of 63.2%. Similarly, the statistical analysis conducted on geographies consisting of 210,034,419 people shows no correlation between the proportion of Immigrants from Israel and labor force participation rate among population ages 16 and over in the United States with a correlation coefficient (R) of -0.044 and weighted average of 65.2%, a difference of 3.1%.
In Labor Force | Age > 16 Correlation Summary
| Measurement | Shoshone | Immigrants from Israel |
| Minimum | 34.9% | 31.5% |
| Maximum | 83.0% | 75.0% |
| Range | 48.1% | 43.5% |
| Mean | 58.0% | 62.0% |
| Median | 59.7% | 63.1% |
| Interquartile 25% (IQ1) | 54.0% | 59.2% |
| Interquartile 75% (IQ3) | 63.1% | 66.1% |
| Interquartile Range (IQR) | 9.1% | 7.0% |
| Standard Deviation (Sample) | 8.4% | 6.9% |
| Standard Deviation (Population) | 8.3% | 6.8% |
Similar Demographics by In Labor Force | Age > 16
Demographics Similar to Shoshone by In Labor Force | Age > 16
In terms of in labor force | age > 16, the demographic groups most similar to Shoshone are Blackfeet (63.2%, a difference of 0.010%), Scotch-Irish (63.3%, a difference of 0.070%), Iroquois (63.2%, a difference of 0.070%), Pennsylvania German (63.4%, a difference of 0.20%), and Chippewa (63.1%, a difference of 0.20%).
| Demographics | Rating | Rank | In Labor Force | Age > 16 |
| Cree | 0.0 /100 | #303 | Tragic 63.5% |
| Immigrants | Nonimmigrants | 0.0 /100 | #304 | Tragic 63.5% |
| Osage | 0.0 /100 | #305 | Tragic 63.5% |
| Blacks/African Americans | 0.0 /100 | #306 | Tragic 63.4% |
| Central American Indians | 0.0 /100 | #307 | Tragic 63.4% |
| Pennsylvania Germans | 0.0 /100 | #308 | Tragic 63.4% |
| Scotch-Irish | 0.0 /100 | #309 | Tragic 63.3% |
| Shoshone | 0.0 /100 | #310 | Tragic 63.2% |
| Blackfeet | 0.0 /100 | #311 | Tragic 63.2% |
| Iroquois | 0.0 /100 | #312 | Tragic 63.2% |
| Chippewa | 0.0 /100 | #313 | Tragic 63.1% |
| Yaqui | 0.0 /100 | #314 | Tragic 63.0% |
| Potawatomi | 0.0 /100 | #315 | Tragic 62.8% |
| Yup'ik | 0.0 /100 | #316 | Tragic 62.7% |
| Kiowa | 0.0 /100 | #317 | Tragic 62.4% |
Demographics Similar to Immigrants from Israel by In Labor Force | Age > 16
In terms of in labor force | age > 16, the demographic groups most similar to Immigrants from Israel are Israeli (65.2%, a difference of 0.0%), Immigrants from Sweden (65.2%, a difference of 0.0%), Arab (65.2%, a difference of 0.010%), Serbian (65.2%, a difference of 0.020%), and Immigrants from Belarus (65.2%, a difference of 0.050%).
| Demographics | Rating | Rank | In Labor Force | Age > 16 |
| South Africans | 69.8 /100 | #163 | Good 65.3% |
| Danes | 68.8 /100 | #164 | Good 65.3% |
| Immigrants | Kazakhstan | 68.1 /100 | #165 | Good 65.3% |
| Immigrants | Western Asia | 67.3 /100 | #166 | Good 65.3% |
| Immigrants | Belarus | 66.0 /100 | #167 | Good 65.2% |
| Serbians | 63.5 /100 | #168 | Good 65.2% |
| Arabs | 62.4 /100 | #169 | Good 65.2% |
| Immigrants | Israel | 61.7 /100 | #170 | Good 65.2% |
| Israelis | 61.6 /100 | #171 | Good 65.2% |
| Immigrants | Sweden | 61.3 /100 | #172 | Good 65.2% |
| Immigrants | Ukraine | 53.7 /100 | #173 | Average 65.1% |
| Macedonians | 50.0 /100 | #174 | Average 65.1% |
| Nicaraguans | 49.7 /100 | #175 | Average 65.1% |
| Swedes | 47.4 /100 | #176 | Average 65.1% |
| Eastern Europeans | 46.2 /100 | #177 | Average 65.1% |