Shoshone vs Immigrants from Barbados Single Mother Poverty
COMPARE
Shoshone
Immigrants from Barbados
Single Mother Poverty
Single Mother Poverty Comparison
Shoshone
Immigrants from Barbados
32.9%
SINGLE MOTHER POVERTY
0.0/ 100
METRIC RATING
292nd/ 347
METRIC RANK
30.2%
SINGLE MOTHER POVERTY
5.0/ 100
METRIC RATING
229th/ 347
METRIC RANK
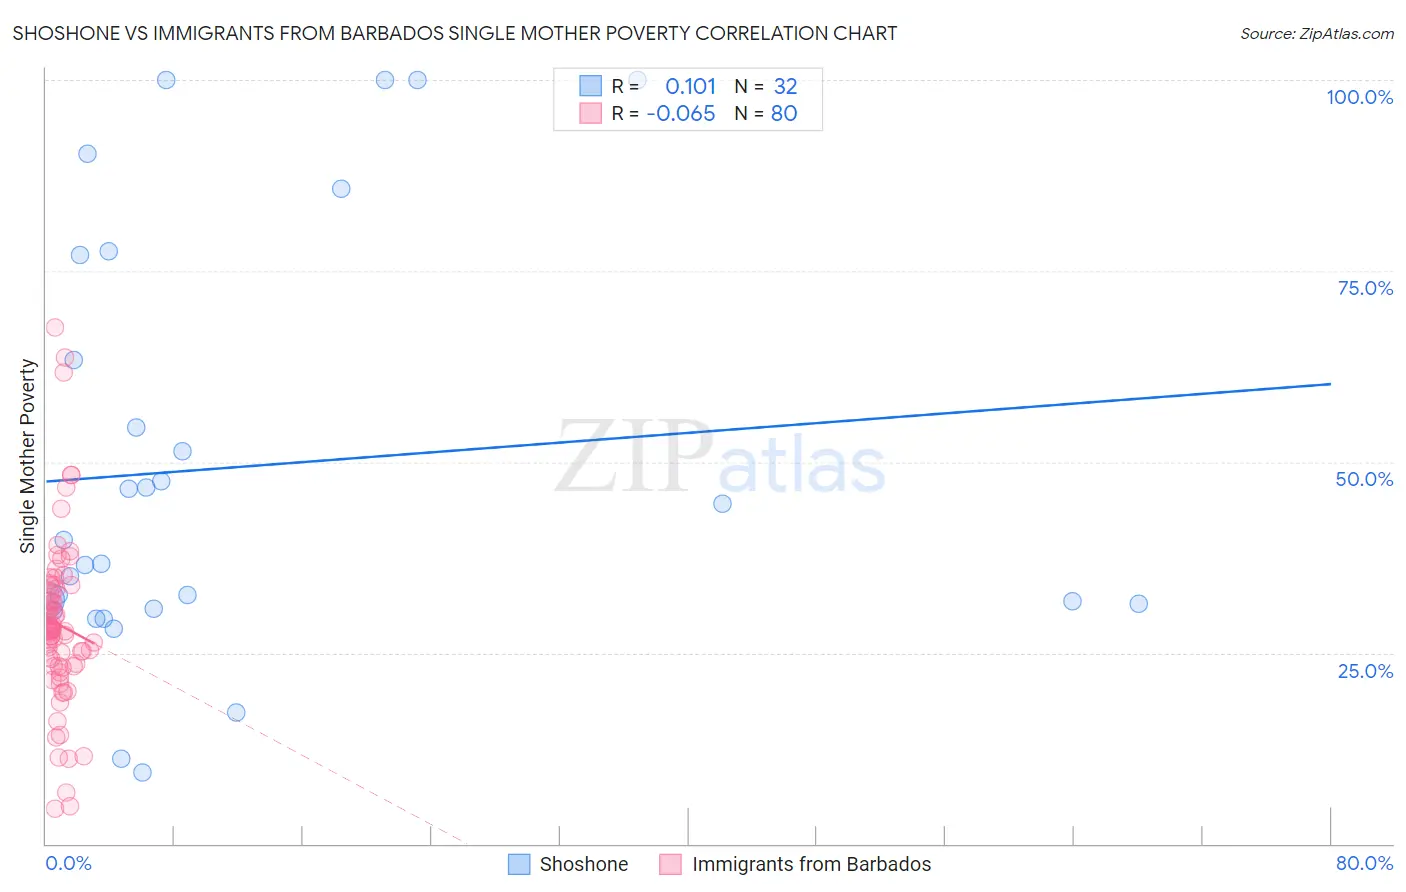
Shoshone vs Immigrants from Barbados Single Mother Poverty Correlation Chart
The statistical analysis conducted on geographies consisting of 66,288,381 people shows a poor positive correlation between the proportion of Shoshone and poverty level among single mothers in the United States with a correlation coefficient (R) of 0.101 and weighted average of 32.9%. Similarly, the statistical analysis conducted on geographies consisting of 111,955,379 people shows a slight negative correlation between the proportion of Immigrants from Barbados and poverty level among single mothers in the United States with a correlation coefficient (R) of -0.065 and weighted average of 30.2%, a difference of 9.0%.
Single Mother Poverty Correlation Summary
| Measurement | Shoshone | Immigrants from Barbados |
| Minimum | 9.3% | 4.6% |
| Maximum | 100.0% | 67.7% |
| Range | 90.7% | 63.0% |
| Mean | 49.3% | 28.7% |
| Median | 38.2% | 27.9% |
| Interquartile 25% (IQ1) | 31.1% | 23.2% |
| Interquartile 75% (IQ3) | 70.2% | 33.2% |
| Interquartile Range (IQR) | 39.1% | 10.0% |
| Standard Deviation (Sample) | 27.4% | 11.2% |
| Standard Deviation (Population) | 27.0% | 11.1% |
Similar Demographics by Single Mother Poverty
Demographics Similar to Shoshone by Single Mother Poverty
In terms of single mother poverty, the demographic groups most similar to Shoshone are Guatemalan (32.9%, a difference of 0.020%), Aleut (32.9%, a difference of 0.030%), French American Indian (33.1%, a difference of 0.66%), Yaqui (33.1%, a difference of 0.69%), and Blackfeet (33.2%, a difference of 0.85%).
| Demographics | Rating | Rank | Single Mother Poverty |
| Immigrants | Latin America | 0.0 /100 | #285 | Tragic 32.4% |
| Yup'ik | 0.0 /100 | #286 | Tragic 32.5% |
| Immigrants | Dominica | 0.0 /100 | #287 | Tragic 32.5% |
| Somalis | 0.0 /100 | #288 | Tragic 32.6% |
| U.S. Virgin Islanders | 0.0 /100 | #289 | Tragic 32.6% |
| Osage | 0.0 /100 | #290 | Tragic 32.6% |
| Guatemalans | 0.0 /100 | #291 | Tragic 32.9% |
| Shoshone | 0.0 /100 | #292 | Tragic 32.9% |
| Aleuts | 0.0 /100 | #293 | Tragic 32.9% |
| French American Indians | 0.0 /100 | #294 | Tragic 33.1% |
| Yaqui | 0.0 /100 | #295 | Tragic 33.1% |
| Blackfeet | 0.0 /100 | #296 | Tragic 33.2% |
| Pennsylvania Germans | 0.0 /100 | #297 | Tragic 33.2% |
| Africans | 0.0 /100 | #298 | Tragic 33.3% |
| Immigrants | Guatemala | 0.0 /100 | #299 | Tragic 33.3% |
Demographics Similar to Immigrants from Barbados by Single Mother Poverty
In terms of single mother poverty, the demographic groups most similar to Immigrants from Barbados are English (30.2%, a difference of 0.040%), Spaniard (30.2%, a difference of 0.090%), Dutch (30.2%, a difference of 0.19%), Immigrants from Liberia (30.1%, a difference of 0.20%), and Scottish (30.1%, a difference of 0.23%).
| Demographics | Rating | Rank | Single Mother Poverty |
| Sudanese | 7.6 /100 | #222 | Tragic 30.0% |
| Immigrants | Cuba | 6.9 /100 | #223 | Tragic 30.1% |
| Immigrants | Sudan | 6.5 /100 | #224 | Tragic 30.1% |
| Spanish | 6.3 /100 | #225 | Tragic 30.1% |
| Scottish | 6.0 /100 | #226 | Tragic 30.1% |
| Immigrants | Liberia | 5.9 /100 | #227 | Tragic 30.1% |
| Spaniards | 5.4 /100 | #228 | Tragic 30.2% |
| Immigrants | Barbados | 5.0 /100 | #229 | Tragic 30.2% |
| English | 4.8 /100 | #230 | Tragic 30.2% |
| Dutch | 4.3 /100 | #231 | Tragic 30.2% |
| Alaskan Athabascans | 4.1 /100 | #232 | Tragic 30.3% |
| Immigrants | Middle Africa | 3.5 /100 | #233 | Tragic 30.3% |
| Immigrants | Nicaragua | 3.5 /100 | #234 | Tragic 30.3% |
| Immigrants | Grenada | 3.4 /100 | #235 | Tragic 30.3% |
| Welsh | 3.2 /100 | #236 | Tragic 30.4% |