Shoshone vs Immigrants from Barbados Currently Married
COMPARE
Shoshone
Immigrants from Barbados
Currently Married
Currently Married Comparison
Shoshone
Immigrants from Barbados
44.0%
CURRENTLY MARRIED
0.2/ 100
METRIC RATING
256th/ 347
METRIC RANK
40.3%
CURRENTLY MARRIED
0.0/ 100
METRIC RATING
331st/ 347
METRIC RANK
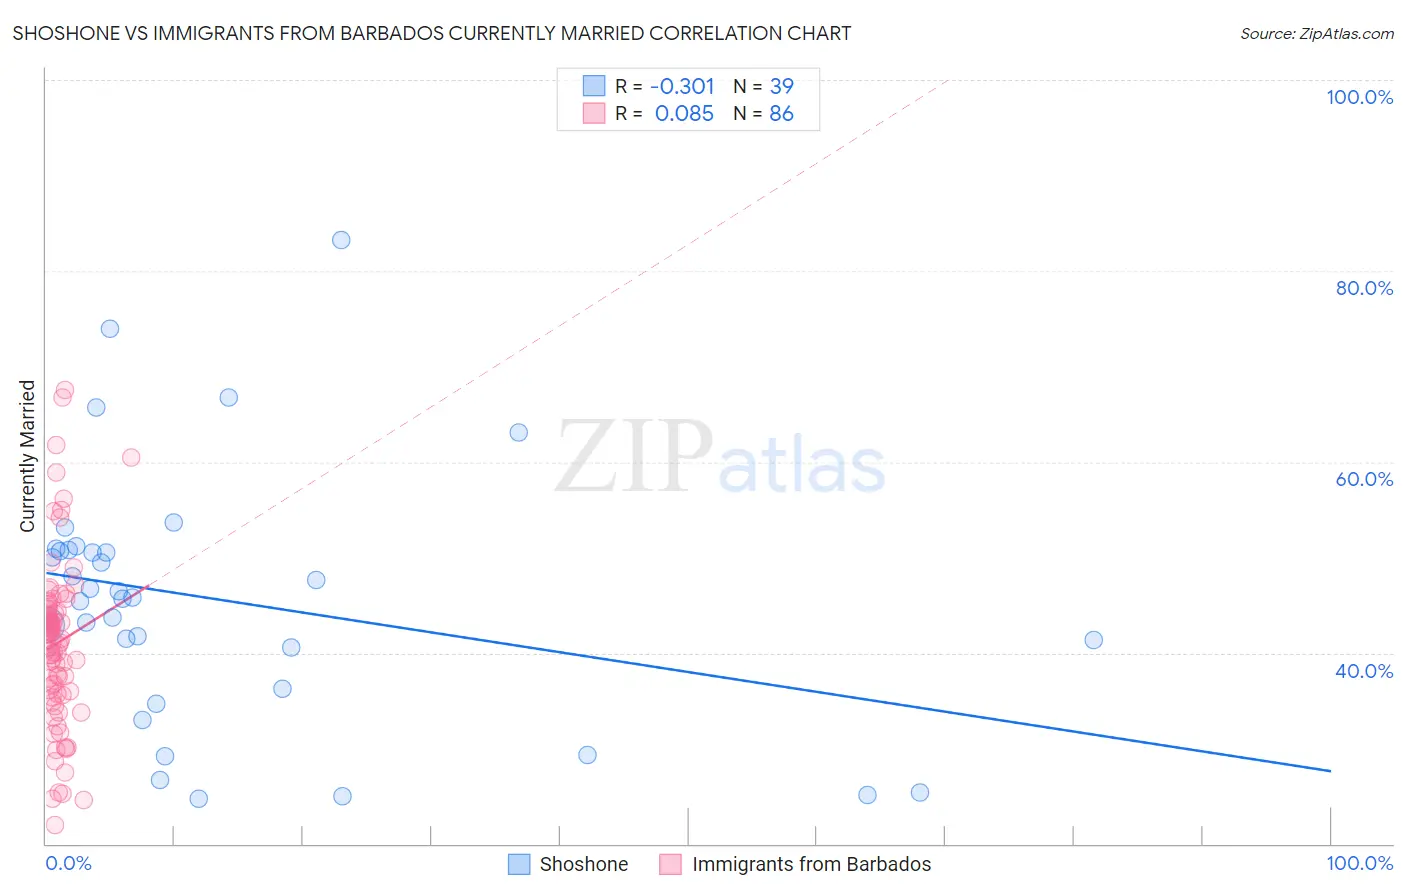
Shoshone vs Immigrants from Barbados Currently Married Correlation Chart
The statistical analysis conducted on geographies consisting of 66,627,152 people shows a mild negative correlation between the proportion of Shoshone and percentage of population currently married in the United States with a correlation coefficient (R) of -0.301 and weighted average of 44.0%. Similarly, the statistical analysis conducted on geographies consisting of 112,780,332 people shows a slight positive correlation between the proportion of Immigrants from Barbados and percentage of population currently married in the United States with a correlation coefficient (R) of 0.085 and weighted average of 40.3%, a difference of 9.0%.
Currently Married Correlation Summary
| Measurement | Shoshone | Immigrants from Barbados |
| Minimum | 24.7% | 22.0% |
| Maximum | 83.3% | 67.5% |
| Range | 58.6% | 45.5% |
| Mean | 45.5% | 41.0% |
| Median | 45.8% | 41.3% |
| Interquartile 25% (IQ1) | 36.3% | 35.8% |
| Interquartile 75% (IQ3) | 50.8% | 44.6% |
| Interquartile Range (IQR) | 14.5% | 8.9% |
| Standard Deviation (Sample) | 13.3% | 8.9% |
| Standard Deviation (Population) | 13.2% | 8.9% |
Similar Demographics by Currently Married
Demographics Similar to Shoshone by Currently Married
In terms of currently married, the demographic groups most similar to Shoshone are Yakama (44.0%, a difference of 0.050%), Vietnamese (44.0%, a difference of 0.12%), Immigrants from Africa (43.9%, a difference of 0.20%), Ute (43.9%, a difference of 0.21%), and Immigrants from Central America (44.1%, a difference of 0.37%).
| Demographics | Rating | Rank | Currently Married |
| Immigrants | Cameroon | 0.3 /100 | #249 | Tragic 44.2% |
| Immigrants | Eastern Africa | 0.3 /100 | #250 | Tragic 44.2% |
| Blackfeet | 0.3 /100 | #251 | Tragic 44.2% |
| Hispanics or Latinos | 0.3 /100 | #252 | Tragic 44.1% |
| Immigrants | Central America | 0.3 /100 | #253 | Tragic 44.1% |
| Vietnamese | 0.2 /100 | #254 | Tragic 44.0% |
| Yakama | 0.2 /100 | #255 | Tragic 44.0% |
| Shoshone | 0.2 /100 | #256 | Tragic 44.0% |
| Immigrants | Africa | 0.2 /100 | #257 | Tragic 43.9% |
| Ute | 0.2 /100 | #258 | Tragic 43.9% |
| Immigrants | Sierra Leone | 0.1 /100 | #259 | Tragic 43.8% |
| Immigrants | Latin America | 0.1 /100 | #260 | Tragic 43.8% |
| Immigrants | Nicaragua | 0.1 /100 | #261 | Tragic 43.7% |
| Bangladeshis | 0.1 /100 | #262 | Tragic 43.7% |
| Immigrants | Cuba | 0.1 /100 | #263 | Tragic 43.7% |
Demographics Similar to Immigrants from Barbados by Currently Married
In terms of currently married, the demographic groups most similar to Immigrants from Barbados are Immigrants from Dominica (40.3%, a difference of 0.020%), Crow (40.4%, a difference of 0.10%), Arapaho (40.5%, a difference of 0.53%), Senegalese (40.6%, a difference of 0.58%), and Immigrants from St. Vincent and the Grenadines (40.1%, a difference of 0.67%).
| Demographics | Rating | Rank | Currently Married |
| Immigrants | Senegal | 0.0 /100 | #324 | Tragic 40.7% |
| U.S. Virgin Islanders | 0.0 /100 | #325 | Tragic 40.7% |
| Barbadians | 0.0 /100 | #326 | Tragic 40.6% |
| Senegalese | 0.0 /100 | #327 | Tragic 40.6% |
| Arapaho | 0.0 /100 | #328 | Tragic 40.5% |
| Crow | 0.0 /100 | #329 | Tragic 40.4% |
| Immigrants | Dominica | 0.0 /100 | #330 | Tragic 40.3% |
| Immigrants | Barbados | 0.0 /100 | #331 | Tragic 40.3% |
| Immigrants | St. Vincent and the Grenadines | 0.0 /100 | #332 | Tragic 40.1% |
| Yup'ik | 0.0 /100 | #333 | Tragic 39.9% |
| Puerto Ricans | 0.0 /100 | #334 | Tragic 39.9% |
| Lumbee | 0.0 /100 | #335 | Tragic 39.8% |
| British West Indians | 0.0 /100 | #336 | Tragic 39.8% |
| Blacks/African Americans | 0.0 /100 | #337 | Tragic 39.6% |
| Cape Verdeans | 0.0 /100 | #338 | Tragic 39.6% |