Shoshone vs Immigrants from Barbados 6th Grade
COMPARE
Shoshone
Immigrants from Barbados
6th Grade
6th Grade Comparison
Shoshone
Immigrants from Barbados
97.6%
6TH GRADE
99.0/ 100
METRIC RATING
84th/ 347
METRIC RANK
96.1%
6TH GRADE
0.0/ 100
METRIC RATING
292nd/ 347
METRIC RANK
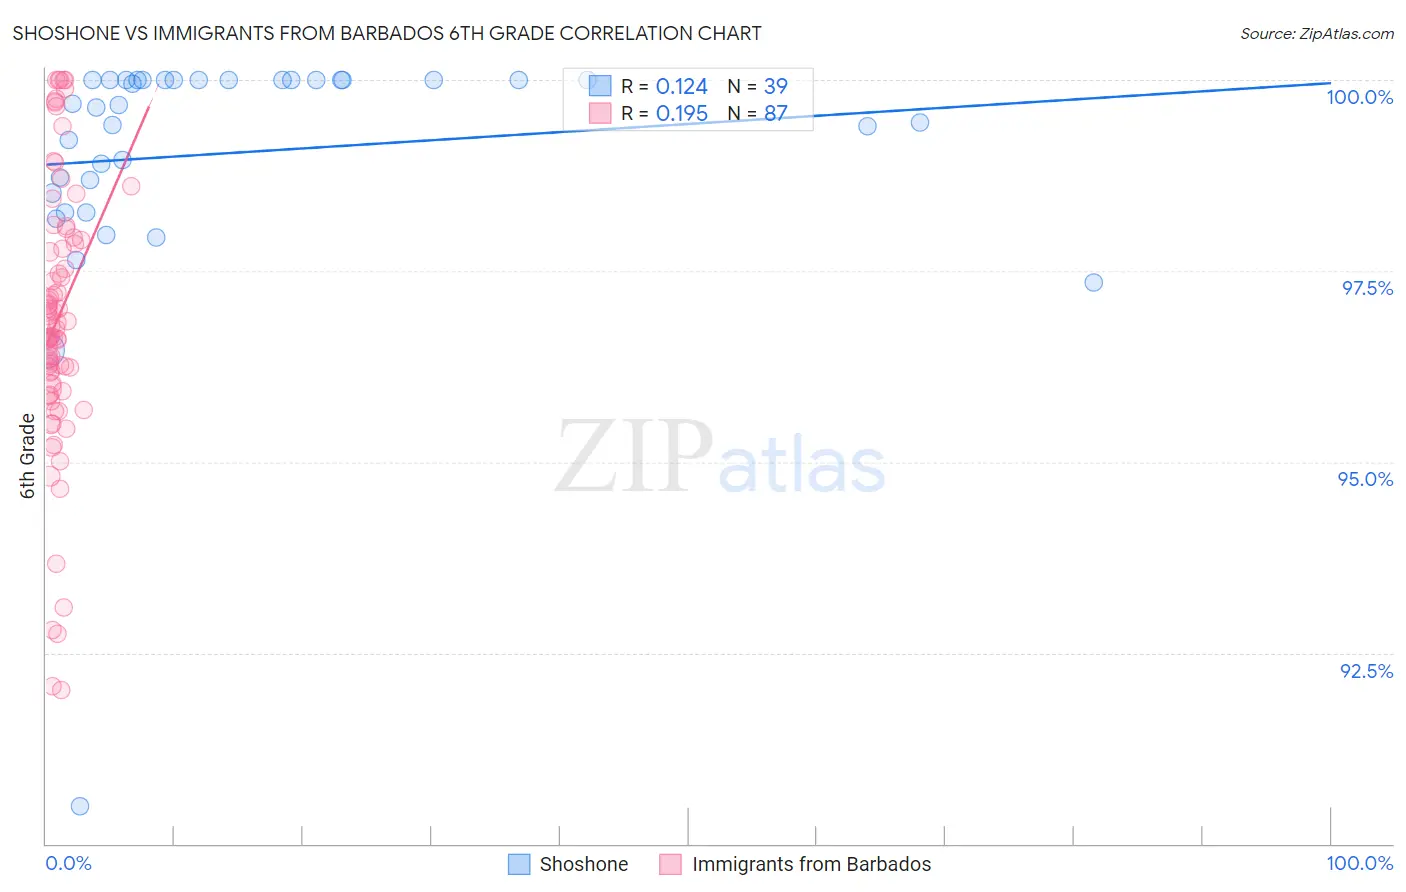
Shoshone vs Immigrants from Barbados 6th Grade Correlation Chart
The statistical analysis conducted on geographies consisting of 66,625,086 people shows a poor positive correlation between the proportion of Shoshone and percentage of population with at least 6th grade education in the United States with a correlation coefficient (R) of 0.124 and weighted average of 97.6%. Similarly, the statistical analysis conducted on geographies consisting of 112,788,359 people shows a poor positive correlation between the proportion of Immigrants from Barbados and percentage of population with at least 6th grade education in the United States with a correlation coefficient (R) of 0.195 and weighted average of 96.1%, a difference of 1.5%.
6th Grade Correlation Summary
| Measurement | Shoshone | Immigrants from Barbados |
| Minimum | 90.5% | 92.0% |
| Maximum | 100.0% | 100.0% |
| Range | 9.5% | 8.0% |
| Mean | 99.0% | 96.9% |
| Median | 99.7% | 96.7% |
| Interquartile 25% (IQ1) | 98.5% | 96.0% |
| Interquartile 75% (IQ3) | 100.0% | 97.9% |
| Interquartile Range (IQR) | 1.5% | 2.0% |
| Standard Deviation (Sample) | 1.7% | 1.8% |
| Standard Deviation (Population) | 1.7% | 1.8% |
Similar Demographics by 6th Grade
Demographics Similar to Shoshone by 6th Grade
In terms of 6th grade, the demographic groups most similar to Shoshone are Zimbabwean (97.6%, a difference of 0.010%), Potawatomi (97.6%, a difference of 0.010%), Delaware (97.6%, a difference of 0.010%), Lumbee (97.6%, a difference of 0.020%), and Immigrants from Belgium (97.5%, a difference of 0.020%).
| Demographics | Rating | Rank | 6th Grade |
| Immigrants | Lithuania | 99.3 /100 | #77 | Exceptional 97.6% |
| Icelanders | 99.3 /100 | #78 | Exceptional 97.6% |
| Immigrants | India | 99.3 /100 | #79 | Exceptional 97.6% |
| Osage | 99.3 /100 | #80 | Exceptional 97.6% |
| Lumbee | 99.2 /100 | #81 | Exceptional 97.6% |
| Zimbabweans | 99.1 /100 | #82 | Exceptional 97.6% |
| Potawatomi | 99.1 /100 | #83 | Exceptional 97.6% |
| Shoshone | 99.0 /100 | #84 | Exceptional 97.6% |
| Delaware | 98.9 /100 | #85 | Exceptional 97.6% |
| Immigrants | Belgium | 98.9 /100 | #86 | Exceptional 97.5% |
| Puget Sound Salish | 98.9 /100 | #87 | Exceptional 97.5% |
| Immigrants | South Africa | 98.9 /100 | #88 | Exceptional 97.5% |
| Immigrants | Australia | 98.8 /100 | #89 | Exceptional 97.5% |
| Pueblo | 98.8 /100 | #90 | Exceptional 97.5% |
| Immigrants | Western Europe | 98.8 /100 | #91 | Exceptional 97.5% |
Demographics Similar to Immigrants from Barbados by 6th Grade
In terms of 6th grade, the demographic groups most similar to Immigrants from Barbados are Immigrants from Somalia (96.1%, a difference of 0.020%), Immigrants from St. Vincent and the Grenadines (96.1%, a difference of 0.020%), Immigrants from Eritrea (96.1%, a difference of 0.040%), Immigrants from West Indies (96.1%, a difference of 0.040%), and Malaysian (96.2%, a difference of 0.060%).
| Demographics | Rating | Rank | 6th Grade |
| Somalis | 0.1 /100 | #285 | Tragic 96.2% |
| Barbadians | 0.0 /100 | #286 | Tragic 96.2% |
| Immigrants | Trinidad and Tobago | 0.0 /100 | #287 | Tragic 96.2% |
| Malaysians | 0.0 /100 | #288 | Tragic 96.2% |
| Immigrants | Eritrea | 0.0 /100 | #289 | Tragic 96.1% |
| Immigrants | Somalia | 0.0 /100 | #290 | Tragic 96.1% |
| Immigrants | St. Vincent and the Grenadines | 0.0 /100 | #291 | Tragic 96.1% |
| Immigrants | Barbados | 0.0 /100 | #292 | Tragic 96.1% |
| Immigrants | West Indies | 0.0 /100 | #293 | Tragic 96.1% |
| British West Indians | 0.0 /100 | #294 | Tragic 96.0% |
| Immigrants | Grenada | 0.0 /100 | #295 | Tragic 95.9% |
| Immigrants | South Eastern Asia | 0.0 /100 | #296 | Tragic 95.9% |
| Haitians | 0.0 /100 | #297 | Tragic 95.8% |
| Sri Lankans | 0.0 /100 | #298 | Tragic 95.8% |
| Immigrants | Laos | 0.0 /100 | #299 | Tragic 95.7% |