Scottish vs Indonesian In Labor Force | Age 25-29
COMPARE
Scottish
Indonesian
In Labor Force | Age 25-29
In Labor Force | Age 25-29 Comparison
Scottish
Indonesians
84.6%
IN LABOR FORCE | AGE 25-29
40.1/ 100
METRIC RATING
183rd/ 347
METRIC RANK
84.7%
IN LABOR FORCE | AGE 25-29
56.5/ 100
METRIC RATING
167th/ 347
METRIC RANK
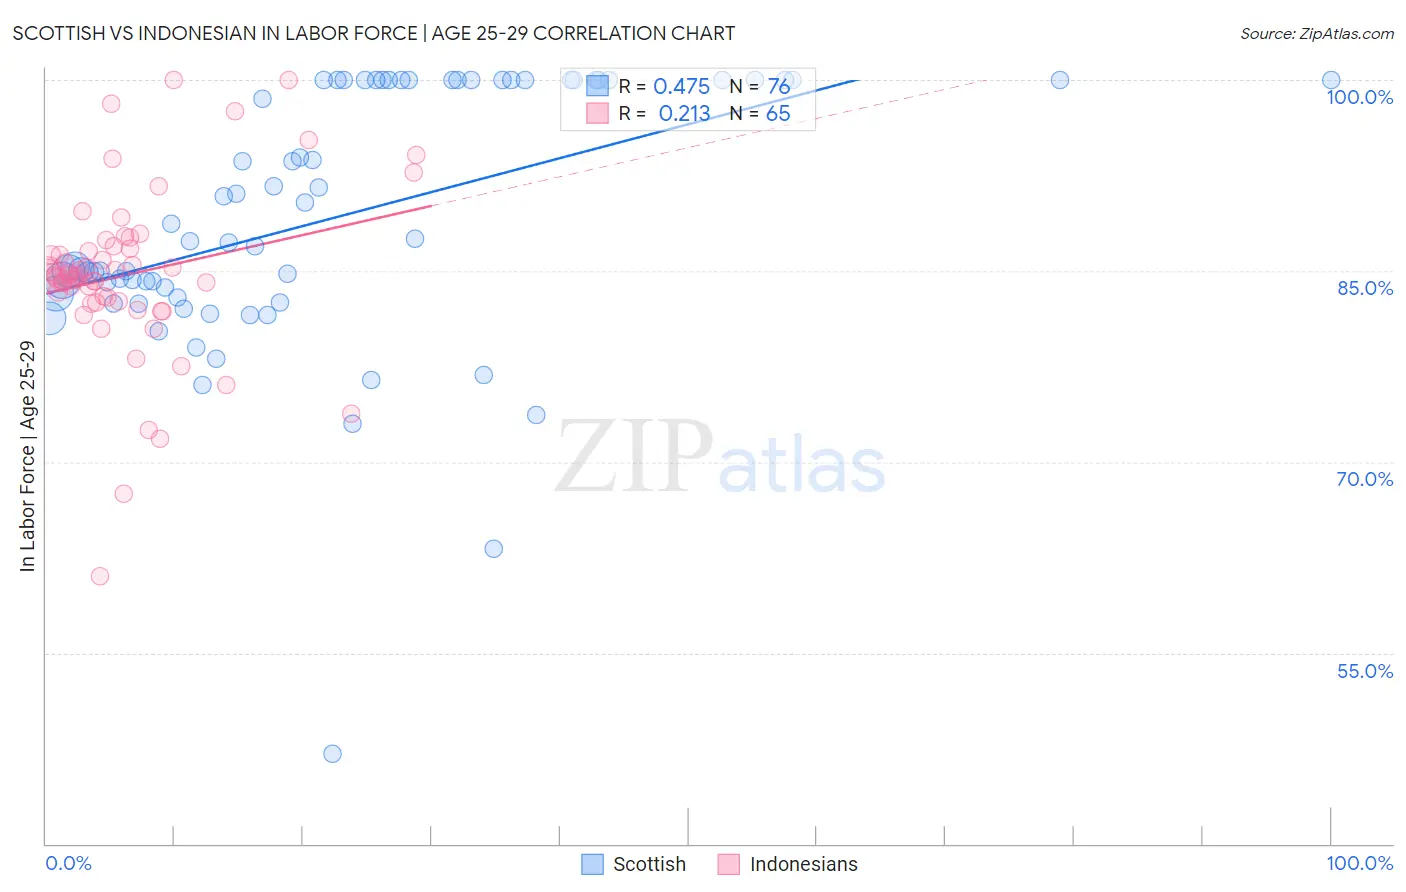
Scottish vs Indonesian In Labor Force | Age 25-29 Correlation Chart
The statistical analysis conducted on geographies consisting of 565,804,130 people shows a moderate positive correlation between the proportion of Scottish and labor force participation rate among population between the ages 25 and 29 in the United States with a correlation coefficient (R) of 0.475 and weighted average of 84.6%. Similarly, the statistical analysis conducted on geographies consisting of 162,720,182 people shows a weak positive correlation between the proportion of Indonesians and labor force participation rate among population between the ages 25 and 29 in the United States with a correlation coefficient (R) of 0.213 and weighted average of 84.7%, a difference of 0.12%.
In Labor Force | Age 25-29 Correlation Summary
| Measurement | Scottish | Indonesian |
| Minimum | 47.0% | 61.0% |
| Maximum | 100.0% | 100.0% |
| Range | 53.0% | 39.0% |
| Mean | 89.2% | 84.7% |
| Median | 87.4% | 84.6% |
| Interquartile 25% (IQ1) | 83.1% | 82.6% |
| Interquartile 75% (IQ3) | 100.0% | 86.8% |
| Interquartile Range (IQR) | 16.9% | 4.2% |
| Standard Deviation (Sample) | 10.2% | 6.7% |
| Standard Deviation (Population) | 10.1% | 6.6% |
Demographics Similar to Scottish and Indonesians by In Labor Force | Age 25-29
In terms of in labor force | age 25-29, the demographic groups most similar to Scottish are European (84.6%, a difference of 0.0%), Immigrants from Norway (84.6%, a difference of 0.010%), Immigrants from Kuwait (84.6%, a difference of 0.010%), Immigrants from South America (84.6%, a difference of 0.020%), and Immigrants from Denmark (84.6%, a difference of 0.020%). Similarly, the demographic groups most similar to Indonesians are Immigrants from Spain (84.7%, a difference of 0.0%), Immigrants from Burma/Myanmar (84.7%, a difference of 0.010%), South American (84.7%, a difference of 0.010%), Celtic (84.7%, a difference of 0.030%), and Tongan (84.7%, a difference of 0.030%).
| Demographics | Rating | Rank | In Labor Force | Age 25-29 |
| Immigrants | Burma/Myanmar | 57.4 /100 | #165 | Average 84.7% |
| Immigrants | Spain | 56.9 /100 | #166 | Average 84.7% |
| Indonesians | 56.5 /100 | #167 | Average 84.7% |
| South Americans | 54.9 /100 | #168 | Average 84.7% |
| Celtics | 52.5 /100 | #169 | Average 84.7% |
| Tongans | 52.4 /100 | #170 | Average 84.7% |
| Immigrants | Vietnam | 50.5 /100 | #171 | Average 84.7% |
| Immigrants | Western Europe | 50.4 /100 | #172 | Average 84.7% |
| Assyrians/Chaldeans/Syriacs | 50.2 /100 | #173 | Average 84.7% |
| Palestinians | 50.0 /100 | #174 | Average 84.7% |
| Hungarians | 47.8 /100 | #175 | Average 84.6% |
| Malaysians | 46.8 /100 | #176 | Average 84.6% |
| Immigrants | China | 45.7 /100 | #177 | Average 84.6% |
| Immigrants | Thailand | 45.2 /100 | #178 | Average 84.6% |
| Immigrants | Argentina | 44.0 /100 | #179 | Average 84.6% |
| Immigrants | South America | 42.9 /100 | #180 | Average 84.6% |
| Immigrants | Norway | 41.9 /100 | #181 | Average 84.6% |
| Europeans | 40.3 /100 | #182 | Average 84.6% |
| Scottish | 40.1 /100 | #183 | Average 84.6% |
| Immigrants | Kuwait | 38.2 /100 | #184 | Fair 84.6% |
| Immigrants | Denmark | 37.0 /100 | #185 | Fair 84.6% |