Scottish vs Cajun In Labor Force | Age 25-29
COMPARE
Scottish
Cajun
In Labor Force | Age 25-29
In Labor Force | Age 25-29 Comparison
Scottish
Cajuns
84.6%
IN LABOR FORCE | AGE 25-29
40.1/ 100
METRIC RATING
183rd/ 347
METRIC RANK
82.5%
IN LABOR FORCE | AGE 25-29
0.0/ 100
METRIC RATING
307th/ 347
METRIC RANK
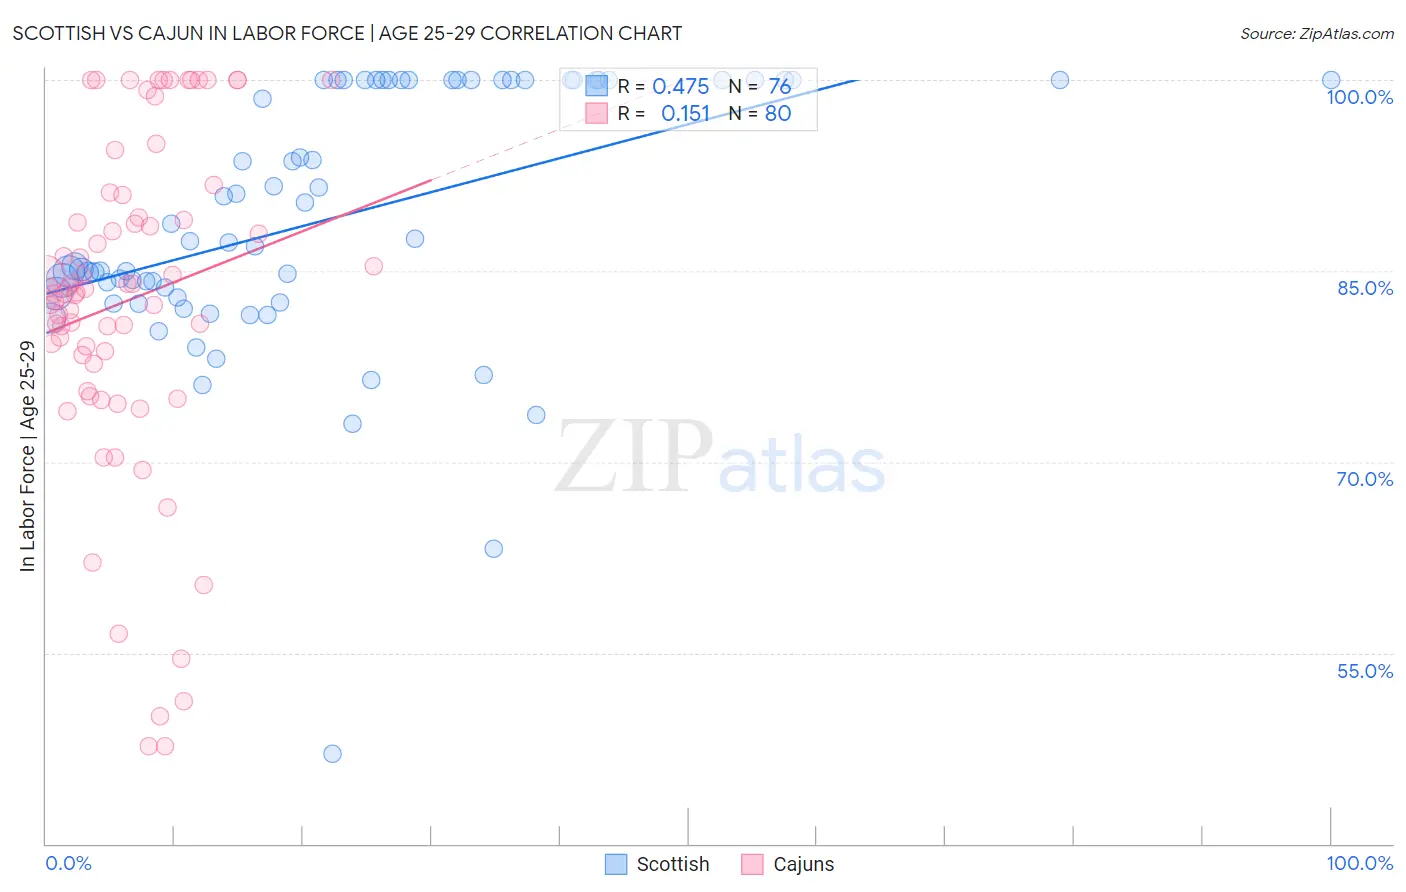
Scottish vs Cajun In Labor Force | Age 25-29 Correlation Chart
The statistical analysis conducted on geographies consisting of 565,804,130 people shows a moderate positive correlation between the proportion of Scottish and labor force participation rate among population between the ages 25 and 29 in the United States with a correlation coefficient (R) of 0.475 and weighted average of 84.6%. Similarly, the statistical analysis conducted on geographies consisting of 149,675,482 people shows a poor positive correlation between the proportion of Cajuns and labor force participation rate among population between the ages 25 and 29 in the United States with a correlation coefficient (R) of 0.151 and weighted average of 82.5%, a difference of 2.5%.
In Labor Force | Age 25-29 Correlation Summary
| Measurement | Scottish | Cajun |
| Minimum | 47.0% | 47.7% |
| Maximum | 100.0% | 100.0% |
| Range | 53.0% | 52.3% |
| Mean | 89.2% | 82.7% |
| Median | 87.4% | 83.4% |
| Interquartile 25% (IQ1) | 83.1% | 78.0% |
| Interquartile 75% (IQ3) | 100.0% | 90.1% |
| Interquartile Range (IQR) | 16.9% | 12.1% |
| Standard Deviation (Sample) | 10.2% | 13.1% |
| Standard Deviation (Population) | 10.1% | 13.0% |
Similar Demographics by In Labor Force | Age 25-29
Demographics Similar to Scottish by In Labor Force | Age 25-29
In terms of in labor force | age 25-29, the demographic groups most similar to Scottish are European (84.6%, a difference of 0.0%), Immigrants from Norway (84.6%, a difference of 0.010%), Immigrants from Kuwait (84.6%, a difference of 0.010%), Immigrants from South America (84.6%, a difference of 0.020%), and Immigrants from Denmark (84.6%, a difference of 0.020%).
| Demographics | Rating | Rank | In Labor Force | Age 25-29 |
| Malaysians | 46.8 /100 | #176 | Average 84.6% |
| Immigrants | China | 45.7 /100 | #177 | Average 84.6% |
| Immigrants | Thailand | 45.2 /100 | #178 | Average 84.6% |
| Immigrants | Argentina | 44.0 /100 | #179 | Average 84.6% |
| Immigrants | South America | 42.9 /100 | #180 | Average 84.6% |
| Immigrants | Norway | 41.9 /100 | #181 | Average 84.6% |
| Europeans | 40.3 /100 | #182 | Average 84.6% |
| Scottish | 40.1 /100 | #183 | Average 84.6% |
| Immigrants | Kuwait | 38.2 /100 | #184 | Fair 84.6% |
| Immigrants | Denmark | 37.0 /100 | #185 | Fair 84.6% |
| Immigrants | Belgium | 35.0 /100 | #186 | Fair 84.6% |
| Immigrants | Portugal | 34.7 /100 | #187 | Fair 84.6% |
| Immigrants | Ukraine | 33.7 /100 | #188 | Fair 84.5% |
| Moroccans | 32.6 /100 | #189 | Fair 84.5% |
| Welsh | 31.1 /100 | #190 | Fair 84.5% |
Demographics Similar to Cajuns by In Labor Force | Age 25-29
In terms of in labor force | age 25-29, the demographic groups most similar to Cajuns are Black/African American (82.6%, a difference of 0.060%), Blackfeet (82.6%, a difference of 0.060%), Central American Indian (82.4%, a difference of 0.15%), Immigrants from Central America (82.4%, a difference of 0.16%), and Immigrants from St. Vincent and the Grenadines (82.7%, a difference of 0.18%).
| Demographics | Rating | Rank | In Labor Force | Age 25-29 |
| Spanish American Indians | 0.0 /100 | #300 | Tragic 82.9% |
| Vietnamese | 0.0 /100 | #301 | Tragic 82.8% |
| Immigrants | Belize | 0.0 /100 | #302 | Tragic 82.8% |
| Immigrants | Grenada | 0.0 /100 | #303 | Tragic 82.8% |
| Immigrants | St. Vincent and the Grenadines | 0.0 /100 | #304 | Tragic 82.7% |
| Blacks/African Americans | 0.0 /100 | #305 | Tragic 82.6% |
| Blackfeet | 0.0 /100 | #306 | Tragic 82.6% |
| Cajuns | 0.0 /100 | #307 | Tragic 82.5% |
| Central American Indians | 0.0 /100 | #308 | Tragic 82.4% |
| Immigrants | Central America | 0.0 /100 | #309 | Tragic 82.4% |
| Osage | 0.0 /100 | #310 | Tragic 82.3% |
| Alaskan Athabascans | 0.0 /100 | #311 | Tragic 82.3% |
| Hispanics or Latinos | 0.0 /100 | #312 | Tragic 82.2% |
| Yaqui | 0.0 /100 | #313 | Tragic 82.2% |
| Cherokee | 0.0 /100 | #314 | Tragic 82.1% |