German Russian vs Immigrants from Fiji In Labor Force | Age 25-29
COMPARE
German Russian
Immigrants from Fiji
In Labor Force | Age 25-29
In Labor Force | Age 25-29 Comparison
German Russians
Immigrants from Fiji
85.8%
IN LABOR FORCE | AGE 25-29
100.0/ 100
METRIC RATING
31st/ 347
METRIC RANK
83.6%
IN LABOR FORCE | AGE 25-29
0.1/ 100
METRIC RATING
262nd/ 347
METRIC RANK
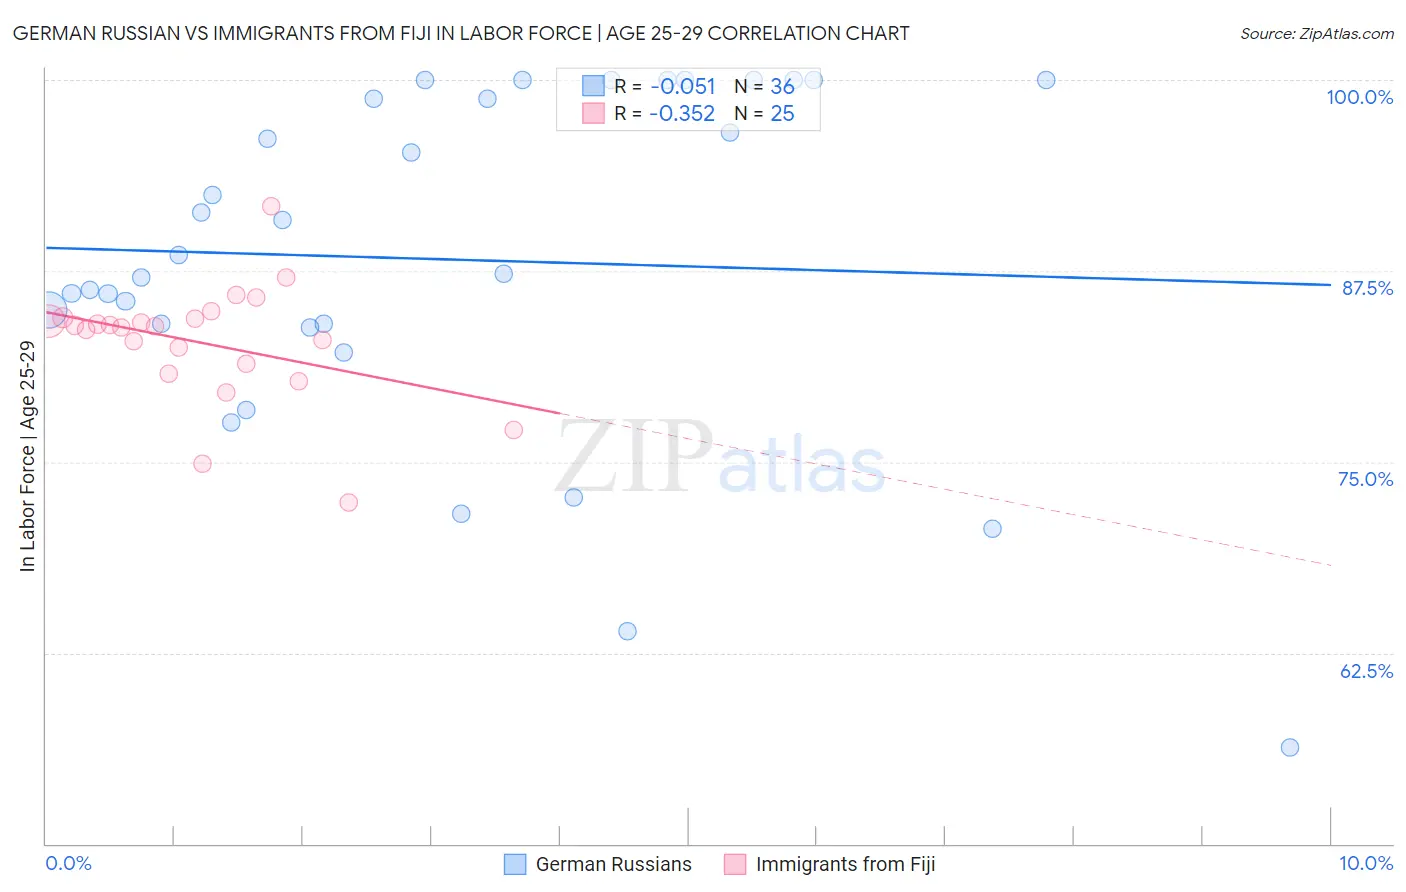
German Russian vs Immigrants from Fiji In Labor Force | Age 25-29 Correlation Chart
The statistical analysis conducted on geographies consisting of 96,455,675 people shows a slight negative correlation between the proportion of German Russians and labor force participation rate among population between the ages 25 and 29 in the United States with a correlation coefficient (R) of -0.051 and weighted average of 85.8%. Similarly, the statistical analysis conducted on geographies consisting of 93,752,229 people shows a mild negative correlation between the proportion of Immigrants from Fiji and labor force participation rate among population between the ages 25 and 29 in the United States with a correlation coefficient (R) of -0.352 and weighted average of 83.6%, a difference of 2.7%.
In Labor Force | Age 25-29 Correlation Summary
| Measurement | German Russian | Immigrants from Fiji |
| Minimum | 56.3% | 72.3% |
| Maximum | 100.0% | 91.7% |
| Range | 43.7% | 19.4% |
| Mean | 88.3% | 82.8% |
| Median | 87.9% | 83.9% |
| Interquartile 25% (IQ1) | 83.9% | 81.1% |
| Interquartile 75% (IQ3) | 99.4% | 84.4% |
| Interquartile Range (IQR) | 15.5% | 3.3% |
| Standard Deviation (Sample) | 11.3% | 3.9% |
| Standard Deviation (Population) | 11.1% | 3.8% |
Similar Demographics by In Labor Force | Age 25-29
Demographics Similar to German Russians by In Labor Force | Age 25-29
In terms of in labor force | age 25-29, the demographic groups most similar to German Russians are Slovak (85.8%, a difference of 0.0%), Immigrants from Bulgaria (85.8%, a difference of 0.0%), Immigrants from Serbia (85.9%, a difference of 0.010%), Lithuanian (85.8%, a difference of 0.030%), and Cypriot (85.8%, a difference of 0.040%).
| Demographics | Rating | Rank | In Labor Force | Age 25-29 |
| Immigrants | Eastern Africa | 100.0 /100 | #24 | Exceptional 86.0% |
| Sudanese | 100.0 /100 | #25 | Exceptional 85.9% |
| Immigrants | North Macedonia | 100.0 /100 | #26 | Exceptional 85.9% |
| Paraguayans | 100.0 /100 | #27 | Exceptional 85.9% |
| Ugandans | 100.0 /100 | #28 | Exceptional 85.9% |
| Immigrants | Liberia | 100.0 /100 | #29 | Exceptional 85.9% |
| Immigrants | Serbia | 100.0 /100 | #30 | Exceptional 85.9% |
| German Russians | 100.0 /100 | #31 | Exceptional 85.8% |
| Slovaks | 100.0 /100 | #32 | Exceptional 85.8% |
| Immigrants | Bulgaria | 100.0 /100 | #33 | Exceptional 85.8% |
| Lithuanians | 99.9 /100 | #34 | Exceptional 85.8% |
| Cypriots | 99.9 /100 | #35 | Exceptional 85.8% |
| Immigrants | Nepal | 99.9 /100 | #36 | Exceptional 85.8% |
| Poles | 99.9 /100 | #37 | Exceptional 85.8% |
| Sierra Leoneans | 99.9 /100 | #38 | Exceptional 85.8% |
Demographics Similar to Immigrants from Fiji by In Labor Force | Age 25-29
In terms of in labor force | age 25-29, the demographic groups most similar to Immigrants from Fiji are West Indian (83.5%, a difference of 0.040%), Pennsylvania German (83.6%, a difference of 0.060%), Immigrants from Bahamas (83.6%, a difference of 0.070%), Immigrants from Guatemala (83.6%, a difference of 0.080%), and Spanish (83.6%, a difference of 0.080%).
| Demographics | Rating | Rank | In Labor Force | Age 25-29 |
| Haitians | 0.2 /100 | #255 | Tragic 83.7% |
| Immigrants | Haiti | 0.2 /100 | #256 | Tragic 83.7% |
| Delaware | 0.2 /100 | #257 | Tragic 83.7% |
| Immigrants | Guatemala | 0.1 /100 | #258 | Tragic 83.6% |
| Spanish | 0.1 /100 | #259 | Tragic 83.6% |
| Immigrants | Bahamas | 0.1 /100 | #260 | Tragic 83.6% |
| Pennsylvania Germans | 0.1 /100 | #261 | Tragic 83.6% |
| Immigrants | Fiji | 0.1 /100 | #262 | Tragic 83.6% |
| West Indians | 0.1 /100 | #263 | Tragic 83.5% |
| Puget Sound Salish | 0.1 /100 | #264 | Tragic 83.5% |
| Cubans | 0.1 /100 | #265 | Tragic 83.5% |
| Aleuts | 0.0 /100 | #266 | Tragic 83.4% |
| Spanish Americans | 0.0 /100 | #267 | Tragic 83.4% |
| Immigrants | Lebanon | 0.0 /100 | #268 | Tragic 83.4% |
| Immigrants | Barbados | 0.0 /100 | #269 | Tragic 83.4% |