Scottish vs Lithuanian In Labor Force | Age 25-29
COMPARE
Scottish
Lithuanian
In Labor Force | Age 25-29
In Labor Force | Age 25-29 Comparison
Scottish
Lithuanians
84.6%
IN LABOR FORCE | AGE 25-29
40.1/ 100
METRIC RATING
183rd/ 347
METRIC RANK
85.8%
IN LABOR FORCE | AGE 25-29
99.9/ 100
METRIC RATING
34th/ 347
METRIC RANK
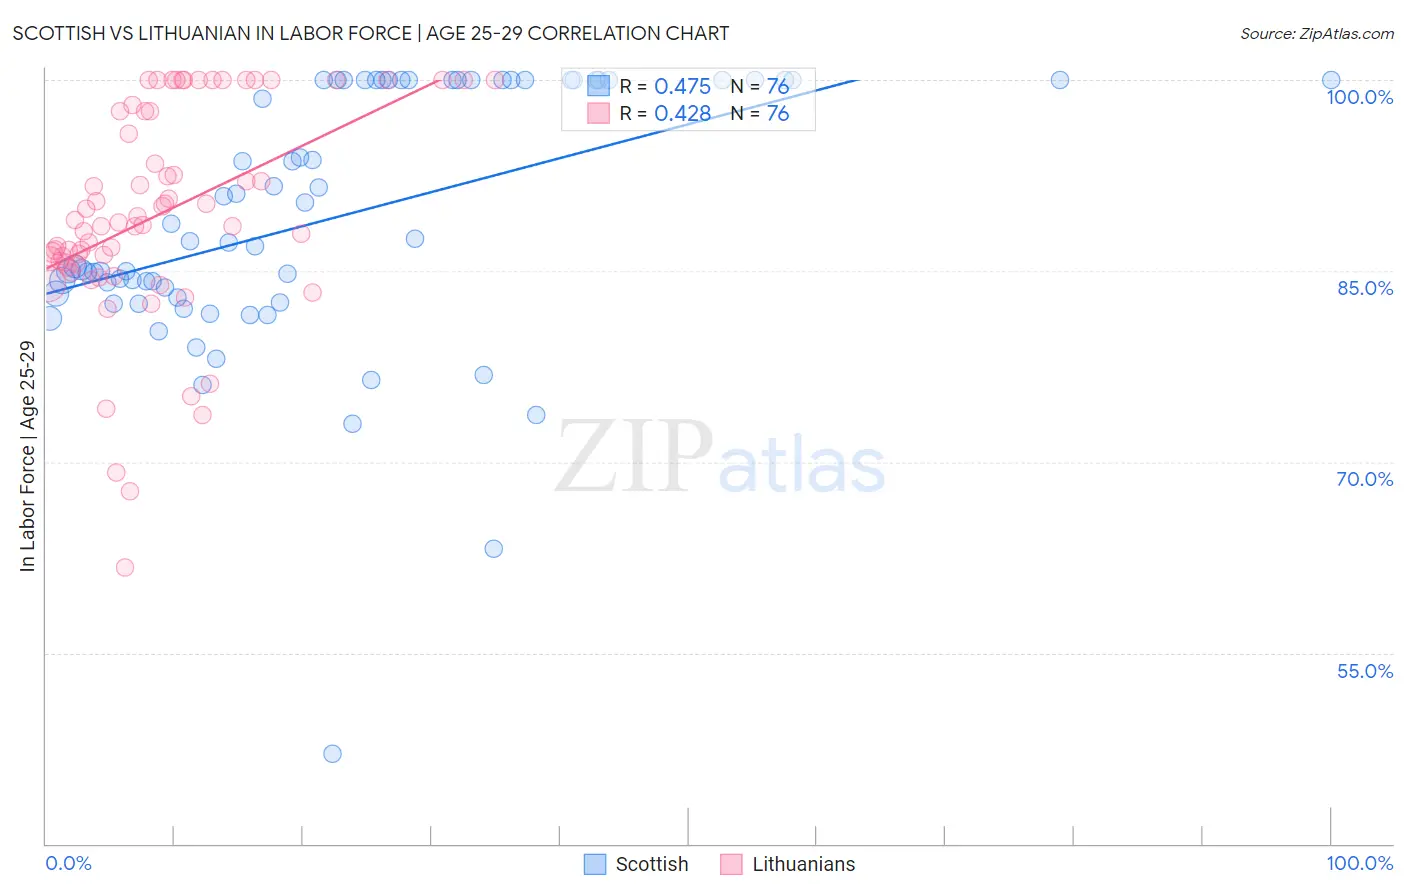
Scottish vs Lithuanian In Labor Force | Age 25-29 Correlation Chart
The statistical analysis conducted on geographies consisting of 565,804,130 people shows a moderate positive correlation between the proportion of Scottish and labor force participation rate among population between the ages 25 and 29 in the United States with a correlation coefficient (R) of 0.475 and weighted average of 84.6%. Similarly, the statistical analysis conducted on geographies consisting of 421,659,157 people shows a moderate positive correlation between the proportion of Lithuanians and labor force participation rate among population between the ages 25 and 29 in the United States with a correlation coefficient (R) of 0.428 and weighted average of 85.8%, a difference of 1.5%.
In Labor Force | Age 25-29 Correlation Summary
| Measurement | Scottish | Lithuanian |
| Minimum | 47.0% | 61.7% |
| Maximum | 100.0% | 100.0% |
| Range | 53.0% | 38.3% |
| Mean | 89.2% | 89.5% |
| Median | 87.4% | 88.7% |
| Interquartile 25% (IQ1) | 83.1% | 85.6% |
| Interquartile 75% (IQ3) | 100.0% | 97.6% |
| Interquartile Range (IQR) | 16.9% | 11.9% |
| Standard Deviation (Sample) | 10.2% | 8.4% |
| Standard Deviation (Population) | 10.1% | 8.3% |
Similar Demographics by In Labor Force | Age 25-29
Demographics Similar to Scottish by In Labor Force | Age 25-29
In terms of in labor force | age 25-29, the demographic groups most similar to Scottish are European (84.6%, a difference of 0.0%), Immigrants from Norway (84.6%, a difference of 0.010%), Immigrants from Kuwait (84.6%, a difference of 0.010%), Immigrants from South America (84.6%, a difference of 0.020%), and Immigrants from Denmark (84.6%, a difference of 0.020%).
| Demographics | Rating | Rank | In Labor Force | Age 25-29 |
| Malaysians | 46.8 /100 | #176 | Average 84.6% |
| Immigrants | China | 45.7 /100 | #177 | Average 84.6% |
| Immigrants | Thailand | 45.2 /100 | #178 | Average 84.6% |
| Immigrants | Argentina | 44.0 /100 | #179 | Average 84.6% |
| Immigrants | South America | 42.9 /100 | #180 | Average 84.6% |
| Immigrants | Norway | 41.9 /100 | #181 | Average 84.6% |
| Europeans | 40.3 /100 | #182 | Average 84.6% |
| Scottish | 40.1 /100 | #183 | Average 84.6% |
| Immigrants | Kuwait | 38.2 /100 | #184 | Fair 84.6% |
| Immigrants | Denmark | 37.0 /100 | #185 | Fair 84.6% |
| Immigrants | Belgium | 35.0 /100 | #186 | Fair 84.6% |
| Immigrants | Portugal | 34.7 /100 | #187 | Fair 84.6% |
| Immigrants | Ukraine | 33.7 /100 | #188 | Fair 84.5% |
| Moroccans | 32.6 /100 | #189 | Fair 84.5% |
| Welsh | 31.1 /100 | #190 | Fair 84.5% |
Demographics Similar to Lithuanians by In Labor Force | Age 25-29
In terms of in labor force | age 25-29, the demographic groups most similar to Lithuanians are Cypriot (85.8%, a difference of 0.010%), Immigrants from Nepal (85.8%, a difference of 0.010%), German Russian (85.8%, a difference of 0.030%), Slovak (85.8%, a difference of 0.030%), and Immigrants from Bulgaria (85.8%, a difference of 0.030%).
| Demographics | Rating | Rank | In Labor Force | Age 25-29 |
| Paraguayans | 100.0 /100 | #27 | Exceptional 85.9% |
| Ugandans | 100.0 /100 | #28 | Exceptional 85.9% |
| Immigrants | Liberia | 100.0 /100 | #29 | Exceptional 85.9% |
| Immigrants | Serbia | 100.0 /100 | #30 | Exceptional 85.9% |
| German Russians | 100.0 /100 | #31 | Exceptional 85.8% |
| Slovaks | 100.0 /100 | #32 | Exceptional 85.8% |
| Immigrants | Bulgaria | 100.0 /100 | #33 | Exceptional 85.8% |
| Lithuanians | 99.9 /100 | #34 | Exceptional 85.8% |
| Cypriots | 99.9 /100 | #35 | Exceptional 85.8% |
| Immigrants | Nepal | 99.9 /100 | #36 | Exceptional 85.8% |
| Poles | 99.9 /100 | #37 | Exceptional 85.8% |
| Sierra Leoneans | 99.9 /100 | #38 | Exceptional 85.8% |
| Croatians | 99.9 /100 | #39 | Exceptional 85.8% |
| Immigrants | Albania | 99.9 /100 | #40 | Exceptional 85.7% |
| Immigrants | Greece | 99.9 /100 | #41 | Exceptional 85.7% |