Potawatomi vs Immigrants from Fiji In Labor Force | Age 25-29
COMPARE
Potawatomi
Immigrants from Fiji
In Labor Force | Age 25-29
In Labor Force | Age 25-29 Comparison
Potawatomi
Immigrants from Fiji
82.9%
IN LABOR FORCE | AGE 25-29
0.0/ 100
METRIC RATING
297th/ 347
METRIC RANK
83.6%
IN LABOR FORCE | AGE 25-29
0.1/ 100
METRIC RATING
262nd/ 347
METRIC RANK
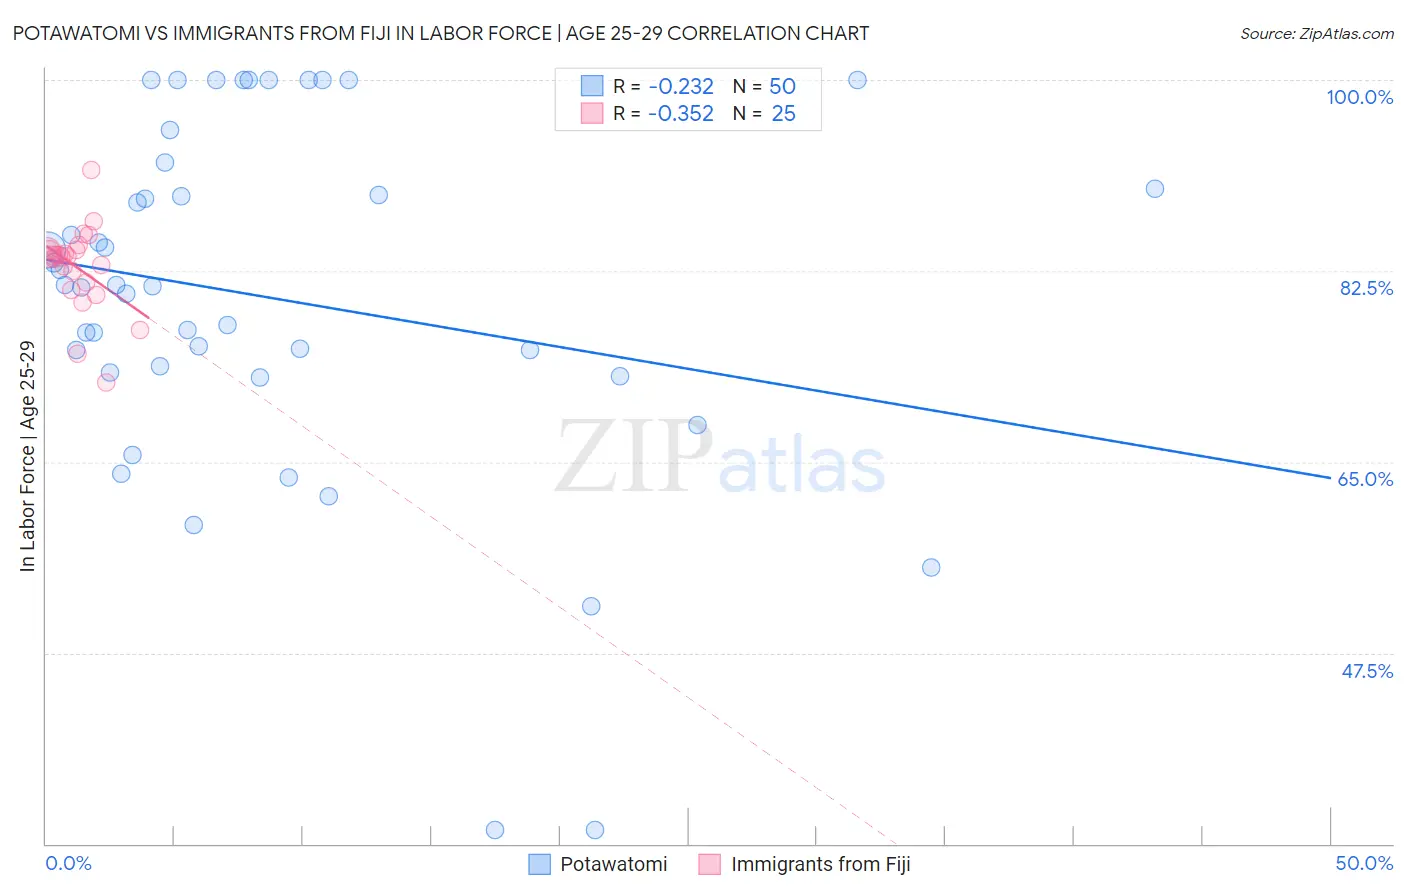
Potawatomi vs Immigrants from Fiji In Labor Force | Age 25-29 Correlation Chart
The statistical analysis conducted on geographies consisting of 117,757,873 people shows a weak negative correlation between the proportion of Potawatomi and labor force participation rate among population between the ages 25 and 29 in the United States with a correlation coefficient (R) of -0.232 and weighted average of 82.9%. Similarly, the statistical analysis conducted on geographies consisting of 93,752,229 people shows a mild negative correlation between the proportion of Immigrants from Fiji and labor force participation rate among population between the ages 25 and 29 in the United States with a correlation coefficient (R) of -0.352 and weighted average of 83.6%, a difference of 0.76%.
In Labor Force | Age 25-29 Correlation Summary
| Measurement | Potawatomi | Immigrants from Fiji |
| Minimum | 31.3% | 72.3% |
| Maximum | 100.0% | 91.7% |
| Range | 68.7% | 19.4% |
| Mean | 80.0% | 82.8% |
| Median | 81.1% | 83.9% |
| Interquartile 25% (IQ1) | 73.2% | 81.1% |
| Interquartile 75% (IQ3) | 90.0% | 84.4% |
| Interquartile Range (IQR) | 16.8% | 3.3% |
| Standard Deviation (Sample) | 16.3% | 3.9% |
| Standard Deviation (Population) | 16.1% | 3.8% |
Similar Demographics by In Labor Force | Age 25-29
Demographics Similar to Potawatomi by In Labor Force | Age 25-29
In terms of in labor force | age 25-29, the demographic groups most similar to Potawatomi are Chippewa (82.9%, a difference of 0.0%), Immigrants from Nicaragua (82.9%, a difference of 0.0%), Immigrants from Latin America (82.9%, a difference of 0.010%), Nepalese (82.9%, a difference of 0.010%), and Native Hawaiian (82.9%, a difference of 0.010%).
| Demographics | Rating | Rank | In Labor Force | Age 25-29 |
| Immigrants | Bangladesh | 0.0 /100 | #290 | Tragic 83.0% |
| Hawaiians | 0.0 /100 | #291 | Tragic 83.0% |
| Immigrants | Guyana | 0.0 /100 | #292 | Tragic 83.0% |
| Immigrants | Latin America | 0.0 /100 | #293 | Tragic 82.9% |
| Nepalese | 0.0 /100 | #294 | Tragic 82.9% |
| Chippewa | 0.0 /100 | #295 | Tragic 82.9% |
| Immigrants | Nicaragua | 0.0 /100 | #296 | Tragic 82.9% |
| Potawatomi | 0.0 /100 | #297 | Tragic 82.9% |
| Native Hawaiians | 0.0 /100 | #298 | Tragic 82.9% |
| Fijians | 0.0 /100 | #299 | Tragic 82.9% |
| Spanish American Indians | 0.0 /100 | #300 | Tragic 82.9% |
| Vietnamese | 0.0 /100 | #301 | Tragic 82.8% |
| Immigrants | Belize | 0.0 /100 | #302 | Tragic 82.8% |
| Immigrants | Grenada | 0.0 /100 | #303 | Tragic 82.8% |
| Immigrants | St. Vincent and the Grenadines | 0.0 /100 | #304 | Tragic 82.7% |
Demographics Similar to Immigrants from Fiji by In Labor Force | Age 25-29
In terms of in labor force | age 25-29, the demographic groups most similar to Immigrants from Fiji are West Indian (83.5%, a difference of 0.040%), Pennsylvania German (83.6%, a difference of 0.060%), Immigrants from Bahamas (83.6%, a difference of 0.070%), Immigrants from Guatemala (83.6%, a difference of 0.080%), and Spanish (83.6%, a difference of 0.080%).
| Demographics | Rating | Rank | In Labor Force | Age 25-29 |
| Haitians | 0.2 /100 | #255 | Tragic 83.7% |
| Immigrants | Haiti | 0.2 /100 | #256 | Tragic 83.7% |
| Delaware | 0.2 /100 | #257 | Tragic 83.7% |
| Immigrants | Guatemala | 0.1 /100 | #258 | Tragic 83.6% |
| Spanish | 0.1 /100 | #259 | Tragic 83.6% |
| Immigrants | Bahamas | 0.1 /100 | #260 | Tragic 83.6% |
| Pennsylvania Germans | 0.1 /100 | #261 | Tragic 83.6% |
| Immigrants | Fiji | 0.1 /100 | #262 | Tragic 83.6% |
| West Indians | 0.1 /100 | #263 | Tragic 83.5% |
| Puget Sound Salish | 0.1 /100 | #264 | Tragic 83.5% |
| Cubans | 0.1 /100 | #265 | Tragic 83.5% |
| Aleuts | 0.0 /100 | #266 | Tragic 83.4% |
| Spanish Americans | 0.0 /100 | #267 | Tragic 83.4% |
| Immigrants | Lebanon | 0.0 /100 | #268 | Tragic 83.4% |
| Immigrants | Barbados | 0.0 /100 | #269 | Tragic 83.4% |