Scandinavian vs Immigrants from Western Europe In Labor Force | Age 20-64
COMPARE
Scandinavian
Immigrants from Western Europe
In Labor Force | Age 20-64
In Labor Force | Age 20-64 Comparison
Scandinavians
Immigrants from Western Europe
79.7%
IN LABOR FORCE | AGE 20-64
72.0/ 100
METRIC RATING
151st/ 347
METRIC RANK
79.1%
IN LABOR FORCE | AGE 20-64
5.9/ 100
METRIC RATING
227th/ 347
METRIC RANK
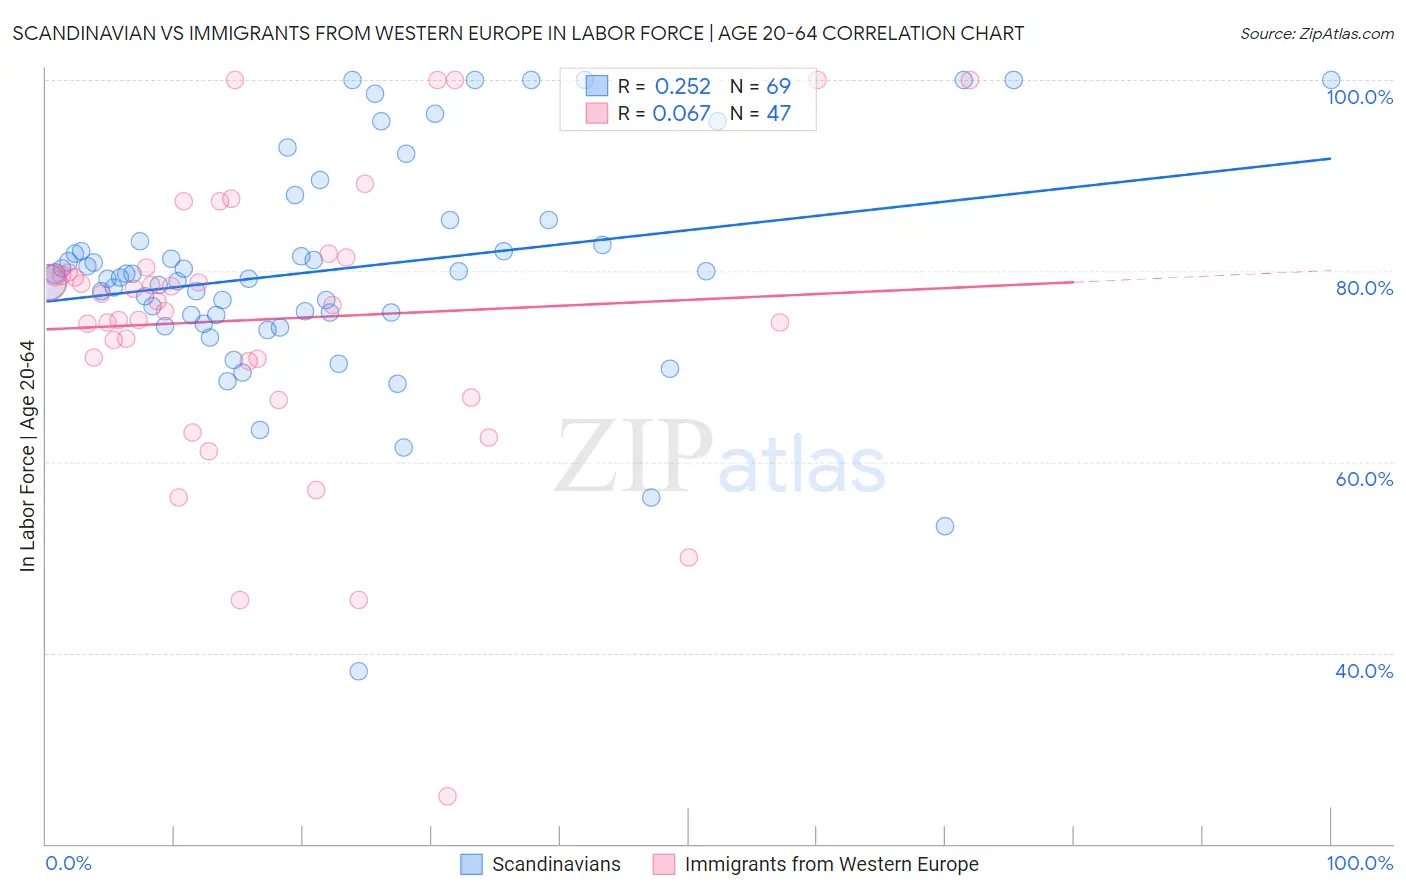
Scandinavian vs Immigrants from Western Europe In Labor Force | Age 20-64 Correlation Chart
The statistical analysis conducted on geographies consisting of 472,639,714 people shows a weak positive correlation between the proportion of Scandinavians and labor force participation rate among population between the ages 20 and 64 in the United States with a correlation coefficient (R) of 0.252 and weighted average of 79.7%. Similarly, the statistical analysis conducted on geographies consisting of 494,082,110 people shows a slight positive correlation between the proportion of Immigrants from Western Europe and labor force participation rate among population between the ages 20 and 64 in the United States with a correlation coefficient (R) of 0.067 and weighted average of 79.1%, a difference of 0.75%.
In Labor Force | Age 20-64 Correlation Summary
| Measurement | Scandinavian | Immigrants from Western Europe |
| Minimum | 38.1% | 25.0% |
| Maximum | 100.0% | 100.0% |
| Range | 61.9% | 75.0% |
| Mean | 80.1% | 74.9% |
| Median | 79.7% | 76.8% |
| Interquartile 25% (IQ1) | 75.4% | 70.6% |
| Interquartile 75% (IQ3) | 84.3% | 80.3% |
| Interquartile Range (IQR) | 8.9% | 9.8% |
| Standard Deviation (Sample) | 11.6% | 15.0% |
| Standard Deviation (Population) | 11.5% | 14.8% |
Similar Demographics by In Labor Force | Age 20-64
Demographics Similar to Scandinavians by In Labor Force | Age 20-64
In terms of in labor force | age 20-64, the demographic groups most similar to Scandinavians are Costa Rican (79.7%, a difference of 0.0%), Immigrants from Northern Europe (79.7%, a difference of 0.0%), Immigrants from Kazakhstan (79.7%, a difference of 0.020%), Icelander (79.7%, a difference of 0.030%), and New Zealander (79.7%, a difference of 0.030%).
| Demographics | Rating | Rank | In Labor Force | Age 20-64 |
| Koreans | 79.6 /100 | #144 | Good 79.8% |
| Pakistanis | 79.3 /100 | #145 | Good 79.8% |
| Immigrants | Southern Europe | 78.9 /100 | #146 | Good 79.8% |
| Immigrants | Philippines | 78.0 /100 | #147 | Good 79.8% |
| Romanians | 77.6 /100 | #148 | Good 79.8% |
| Icelanders | 75.1 /100 | #149 | Good 79.7% |
| Costa Ricans | 72.4 /100 | #150 | Good 79.7% |
| Scandinavians | 72.0 /100 | #151 | Good 79.7% |
| Immigrants | Northern Europe | 72.0 /100 | #152 | Good 79.7% |
| Immigrants | Kazakhstan | 69.5 /100 | #153 | Good 79.7% |
| New Zealanders | 69.4 /100 | #154 | Good 79.7% |
| Immigrants | South Africa | 69.2 /100 | #155 | Good 79.7% |
| Senegalese | 69.1 /100 | #156 | Good 79.7% |
| Immigrants | China | 69.1 /100 | #157 | Good 79.7% |
| Austrians | 67.6 /100 | #158 | Good 79.7% |
Demographics Similar to Immigrants from Western Europe by In Labor Force | Age 20-64
In terms of in labor force | age 20-64, the demographic groups most similar to Immigrants from Western Europe are Central American (79.1%, a difference of 0.0%), Panamanian (79.1%, a difference of 0.010%), Alsatian (79.1%, a difference of 0.010%), Native Hawaiian (79.1%, a difference of 0.010%), and Portuguese (79.1%, a difference of 0.020%).
| Demographics | Rating | Rank | In Labor Force | Age 20-64 |
| Immigrants | Immigrants | 7.7 /100 | #220 | Tragic 79.2% |
| Hungarians | 7.2 /100 | #221 | Tragic 79.2% |
| Immigrants | Panama | 6.9 /100 | #222 | Tragic 79.1% |
| Canadians | 6.8 /100 | #223 | Tragic 79.1% |
| Immigrants | Uzbekistan | 6.8 /100 | #224 | Tragic 79.1% |
| Portuguese | 6.4 /100 | #225 | Tragic 79.1% |
| Central Americans | 5.9 /100 | #226 | Tragic 79.1% |
| Immigrants | Western Europe | 5.9 /100 | #227 | Tragic 79.1% |
| Panamanians | 5.7 /100 | #228 | Tragic 79.1% |
| Alsatians | 5.7 /100 | #229 | Tragic 79.1% |
| Native Hawaiians | 5.6 /100 | #230 | Tragic 79.1% |
| Lebanese | 5.1 /100 | #231 | Tragic 79.1% |
| Guamanians/Chamorros | 4.5 /100 | #232 | Tragic 79.1% |
| Japanese | 4.0 /100 | #233 | Tragic 79.1% |
| Immigrants | Canada | 3.2 /100 | #234 | Tragic 79.0% |