Scandinavian vs Immigrants from Australia In Labor Force | Age 20-64
COMPARE
Scandinavian
Immigrants from Australia
In Labor Force | Age 20-64
In Labor Force | Age 20-64 Comparison
Scandinavians
Immigrants from Australia
79.7%
IN LABOR FORCE | AGE 20-64
72.0/ 100
METRIC RATING
151st/ 347
METRIC RANK
80.0%
IN LABOR FORCE | AGE 20-64
95.5/ 100
METRIC RATING
102nd/ 347
METRIC RANK
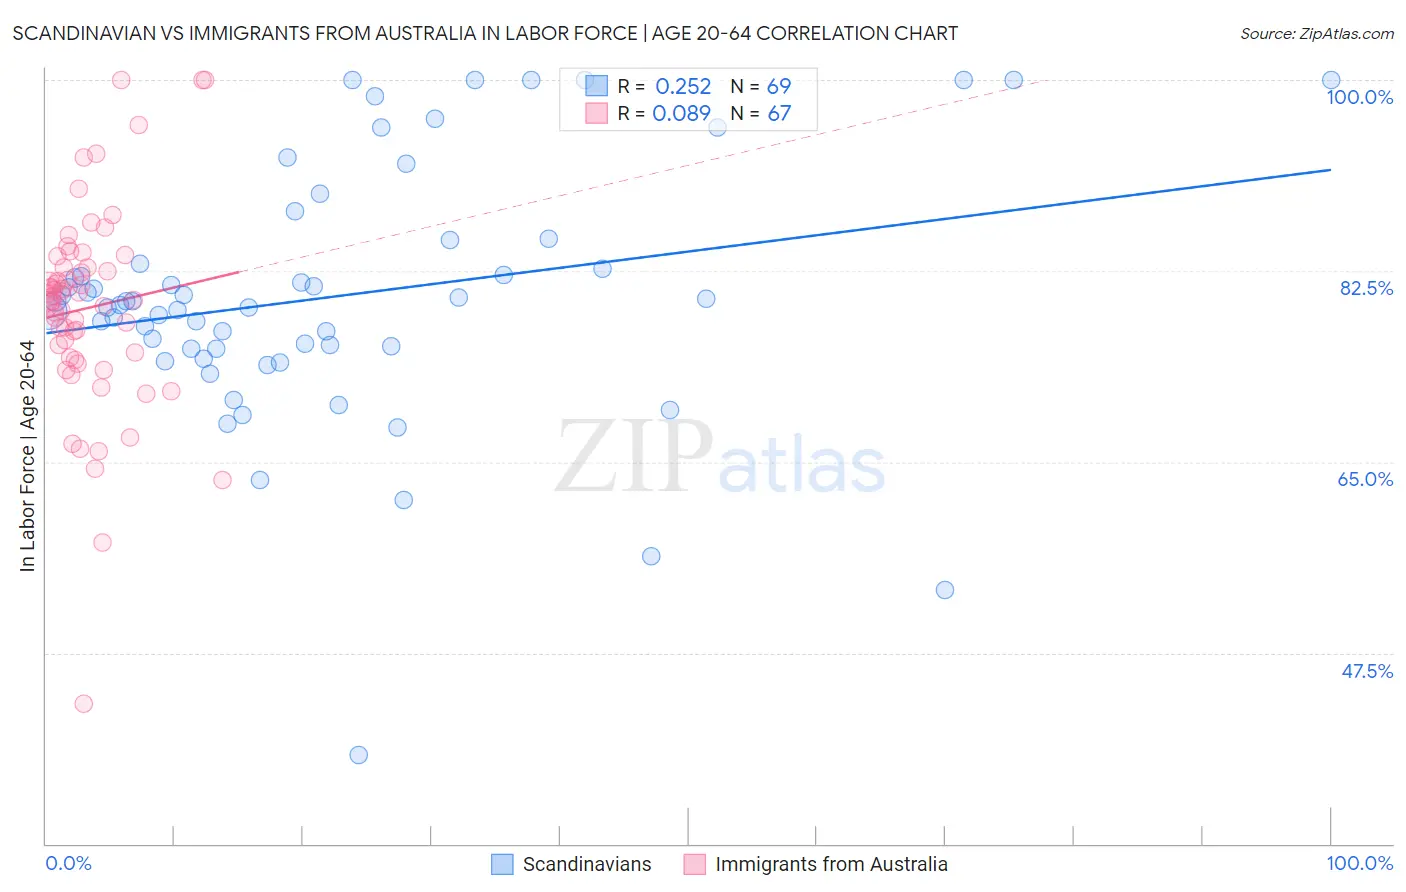
Scandinavian vs Immigrants from Australia In Labor Force | Age 20-64 Correlation Chart
The statistical analysis conducted on geographies consisting of 472,639,714 people shows a weak positive correlation between the proportion of Scandinavians and labor force participation rate among population between the ages 20 and 64 in the United States with a correlation coefficient (R) of 0.252 and weighted average of 79.7%. Similarly, the statistical analysis conducted on geographies consisting of 227,207,556 people shows a slight positive correlation between the proportion of Immigrants from Australia and labor force participation rate among population between the ages 20 and 64 in the United States with a correlation coefficient (R) of 0.089 and weighted average of 80.0%, a difference of 0.42%.
In Labor Force | Age 20-64 Correlation Summary
| Measurement | Scandinavian | Immigrants from Australia |
| Minimum | 38.1% | 42.8% |
| Maximum | 100.0% | 100.0% |
| Range | 61.9% | 57.2% |
| Mean | 80.1% | 79.1% |
| Median | 79.7% | 79.8% |
| Interquartile 25% (IQ1) | 75.4% | 74.5% |
| Interquartile 75% (IQ3) | 84.3% | 82.8% |
| Interquartile Range (IQR) | 8.9% | 8.3% |
| Standard Deviation (Sample) | 11.6% | 9.4% |
| Standard Deviation (Population) | 11.5% | 9.3% |
Similar Demographics by In Labor Force | Age 20-64
Demographics Similar to Scandinavians by In Labor Force | Age 20-64
In terms of in labor force | age 20-64, the demographic groups most similar to Scandinavians are Costa Rican (79.7%, a difference of 0.0%), Immigrants from Northern Europe (79.7%, a difference of 0.0%), Immigrants from Kazakhstan (79.7%, a difference of 0.020%), Icelander (79.7%, a difference of 0.030%), and New Zealander (79.7%, a difference of 0.030%).
| Demographics | Rating | Rank | In Labor Force | Age 20-64 |
| Koreans | 79.6 /100 | #144 | Good 79.8% |
| Pakistanis | 79.3 /100 | #145 | Good 79.8% |
| Immigrants | Southern Europe | 78.9 /100 | #146 | Good 79.8% |
| Immigrants | Philippines | 78.0 /100 | #147 | Good 79.8% |
| Romanians | 77.6 /100 | #148 | Good 79.8% |
| Icelanders | 75.1 /100 | #149 | Good 79.7% |
| Costa Ricans | 72.4 /100 | #150 | Good 79.7% |
| Scandinavians | 72.0 /100 | #151 | Good 79.7% |
| Immigrants | Northern Europe | 72.0 /100 | #152 | Good 79.7% |
| Immigrants | Kazakhstan | 69.5 /100 | #153 | Good 79.7% |
| New Zealanders | 69.4 /100 | #154 | Good 79.7% |
| Immigrants | South Africa | 69.2 /100 | #155 | Good 79.7% |
| Senegalese | 69.1 /100 | #156 | Good 79.7% |
| Immigrants | China | 69.1 /100 | #157 | Good 79.7% |
| Austrians | 67.6 /100 | #158 | Good 79.7% |
Demographics Similar to Immigrants from Australia by In Labor Force | Age 20-64
In terms of in labor force | age 20-64, the demographic groups most similar to Immigrants from Australia are Filipino (80.1%, a difference of 0.0%), Palestinian (80.0%, a difference of 0.0%), Russian (80.0%, a difference of 0.0%), Immigrants from Chile (80.1%, a difference of 0.010%), and Venezuelan (80.0%, a difference of 0.010%).
| Demographics | Rating | Rank | In Labor Force | Age 20-64 |
| Yugoslavians | 95.9 /100 | #95 | Exceptional 80.1% |
| Immigrants | Malaysia | 95.9 /100 | #96 | Exceptional 80.1% |
| South Americans | 95.9 /100 | #97 | Exceptional 80.1% |
| Immigrants | Uruguay | 95.8 /100 | #98 | Exceptional 80.1% |
| Immigrants | Chile | 95.7 /100 | #99 | Exceptional 80.1% |
| Filipinos | 95.6 /100 | #100 | Exceptional 80.1% |
| Palestinians | 95.5 /100 | #101 | Exceptional 80.0% |
| Immigrants | Australia | 95.5 /100 | #102 | Exceptional 80.0% |
| Russians | 95.5 /100 | #103 | Exceptional 80.0% |
| Venezuelans | 95.3 /100 | #104 | Exceptional 80.0% |
| Immigrants | Ghana | 95.0 /100 | #105 | Exceptional 80.0% |
| Greeks | 94.8 /100 | #106 | Exceptional 80.0% |
| Immigrants | Jordan | 94.8 /100 | #107 | Exceptional 80.0% |
| Iranians | 94.3 /100 | #108 | Exceptional 80.0% |
| Immigrants | Argentina | 94.1 /100 | #109 | Exceptional 80.0% |