African vs Immigrants from Western Europe In Labor Force | Age 20-64
COMPARE
African
Immigrants from Western Europe
In Labor Force | Age 20-64
In Labor Force | Age 20-64 Comparison
Africans
Immigrants from Western Europe
77.9%
IN LABOR FORCE | AGE 20-64
0.0/ 100
METRIC RATING
289th/ 347
METRIC RANK
79.1%
IN LABOR FORCE | AGE 20-64
5.9/ 100
METRIC RATING
227th/ 347
METRIC RANK
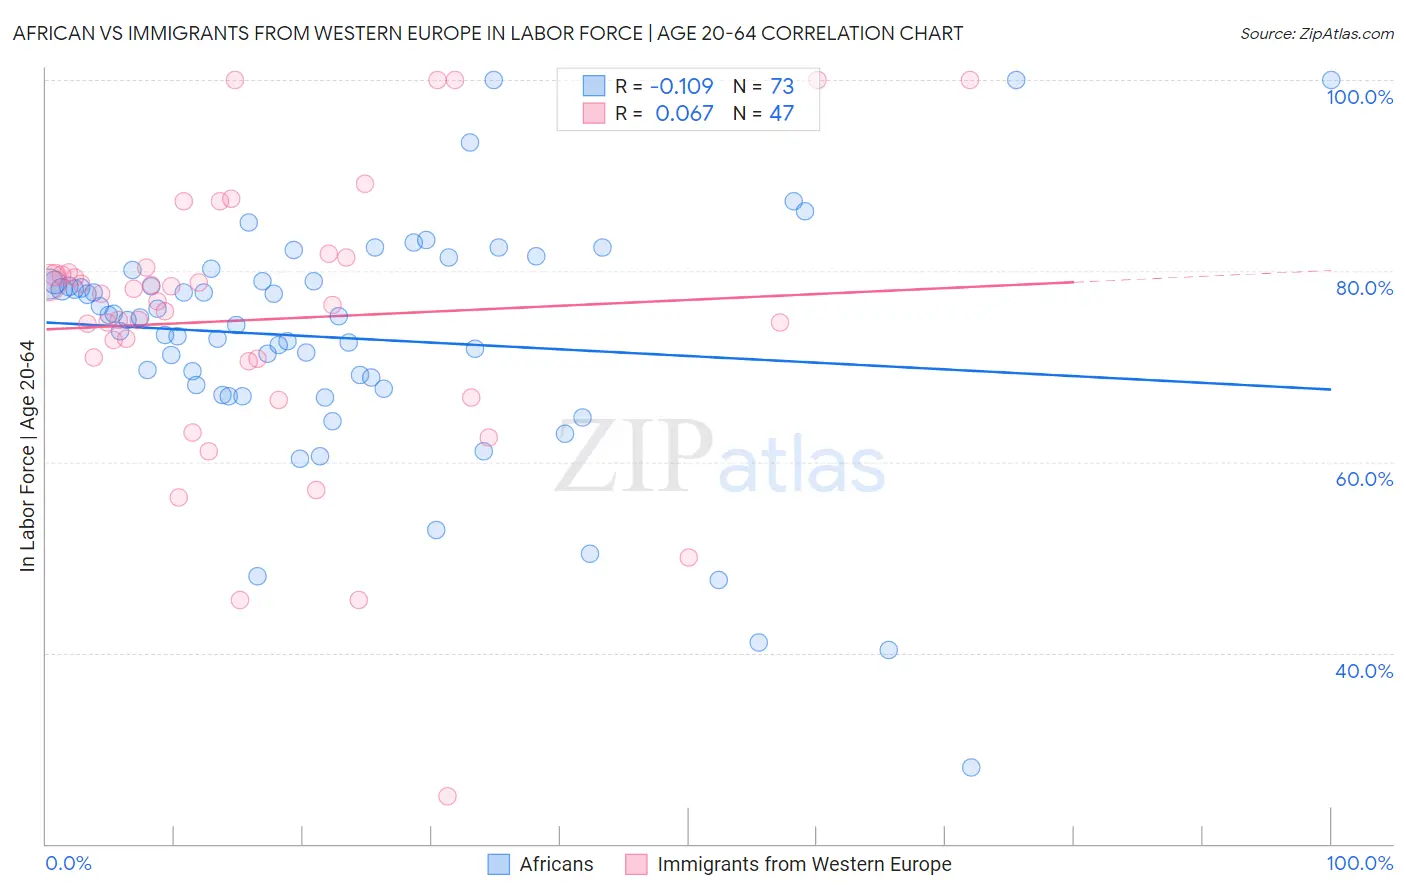
African vs Immigrants from Western Europe In Labor Force | Age 20-64 Correlation Chart
The statistical analysis conducted on geographies consisting of 470,088,010 people shows a poor negative correlation between the proportion of Africans and labor force participation rate among population between the ages 20 and 64 in the United States with a correlation coefficient (R) of -0.109 and weighted average of 77.9%. Similarly, the statistical analysis conducted on geographies consisting of 494,082,110 people shows a slight positive correlation between the proportion of Immigrants from Western Europe and labor force participation rate among population between the ages 20 and 64 in the United States with a correlation coefficient (R) of 0.067 and weighted average of 79.1%, a difference of 1.6%.
In Labor Force | Age 20-64 Correlation Summary
| Measurement | African | Immigrants from Western Europe |
| Minimum | 28.0% | 25.0% |
| Maximum | 100.0% | 100.0% |
| Range | 72.0% | 75.0% |
| Mean | 73.0% | 74.9% |
| Median | 75.1% | 76.8% |
| Interquartile 25% (IQ1) | 67.9% | 70.6% |
| Interquartile 75% (IQ3) | 79.0% | 80.3% |
| Interquartile Range (IQR) | 11.1% | 9.8% |
| Standard Deviation (Sample) | 12.7% | 15.0% |
| Standard Deviation (Population) | 12.6% | 14.8% |
Similar Demographics by In Labor Force | Age 20-64
Demographics Similar to Africans by In Labor Force | Age 20-64
In terms of in labor force | age 20-64, the demographic groups most similar to Africans are Hmong (77.9%, a difference of 0.010%), Immigrants from Bangladesh (77.9%, a difference of 0.010%), Spanish American (77.8%, a difference of 0.070%), Vietnamese (78.0%, a difference of 0.080%), and Immigrants from Belize (78.0%, a difference of 0.090%).
| Demographics | Rating | Rank | In Labor Force | Age 20-64 |
| Immigrants | St. Vincent and the Grenadines | 0.0 /100 | #282 | Tragic 78.1% |
| Immigrants | Nonimmigrants | 0.0 /100 | #283 | Tragic 78.1% |
| Immigrants | Guyana | 0.0 /100 | #284 | Tragic 78.1% |
| Osage | 0.0 /100 | #285 | Tragic 78.0% |
| Immigrants | Belize | 0.0 /100 | #286 | Tragic 78.0% |
| Vietnamese | 0.0 /100 | #287 | Tragic 78.0% |
| Hmong | 0.0 /100 | #288 | Tragic 77.9% |
| Africans | 0.0 /100 | #289 | Tragic 77.9% |
| Immigrants | Bangladesh | 0.0 /100 | #290 | Tragic 77.9% |
| Spanish Americans | 0.0 /100 | #291 | Tragic 77.8% |
| Immigrants | Azores | 0.0 /100 | #292 | Tragic 77.8% |
| Delaware | 0.0 /100 | #293 | Tragic 77.8% |
| Immigrants | Central America | 0.0 /100 | #294 | Tragic 77.7% |
| Immigrants | Grenada | 0.0 /100 | #295 | Tragic 77.7% |
| Immigrants | Dominican Republic | 0.0 /100 | #296 | Tragic 77.7% |
Demographics Similar to Immigrants from Western Europe by In Labor Force | Age 20-64
In terms of in labor force | age 20-64, the demographic groups most similar to Immigrants from Western Europe are Central American (79.1%, a difference of 0.0%), Panamanian (79.1%, a difference of 0.010%), Alsatian (79.1%, a difference of 0.010%), Native Hawaiian (79.1%, a difference of 0.010%), and Portuguese (79.1%, a difference of 0.020%).
| Demographics | Rating | Rank | In Labor Force | Age 20-64 |
| Immigrants | Immigrants | 7.7 /100 | #220 | Tragic 79.2% |
| Hungarians | 7.2 /100 | #221 | Tragic 79.2% |
| Immigrants | Panama | 6.9 /100 | #222 | Tragic 79.1% |
| Canadians | 6.8 /100 | #223 | Tragic 79.1% |
| Immigrants | Uzbekistan | 6.8 /100 | #224 | Tragic 79.1% |
| Portuguese | 6.4 /100 | #225 | Tragic 79.1% |
| Central Americans | 5.9 /100 | #226 | Tragic 79.1% |
| Immigrants | Western Europe | 5.9 /100 | #227 | Tragic 79.1% |
| Panamanians | 5.7 /100 | #228 | Tragic 79.1% |
| Alsatians | 5.7 /100 | #229 | Tragic 79.1% |
| Native Hawaiians | 5.6 /100 | #230 | Tragic 79.1% |
| Lebanese | 5.1 /100 | #231 | Tragic 79.1% |
| Guamanians/Chamorros | 4.5 /100 | #232 | Tragic 79.1% |
| Japanese | 4.0 /100 | #233 | Tragic 79.1% |
| Immigrants | Canada | 3.2 /100 | #234 | Tragic 79.0% |