British vs Immigrants from Western Europe In Labor Force | Age 20-64
COMPARE
British
Immigrants from Western Europe
In Labor Force | Age 20-64
In Labor Force | Age 20-64 Comparison
British
Immigrants from Western Europe
79.3%
IN LABOR FORCE | AGE 20-64
16.5/ 100
METRIC RATING
208th/ 347
METRIC RANK
79.1%
IN LABOR FORCE | AGE 20-64
5.9/ 100
METRIC RATING
227th/ 347
METRIC RANK
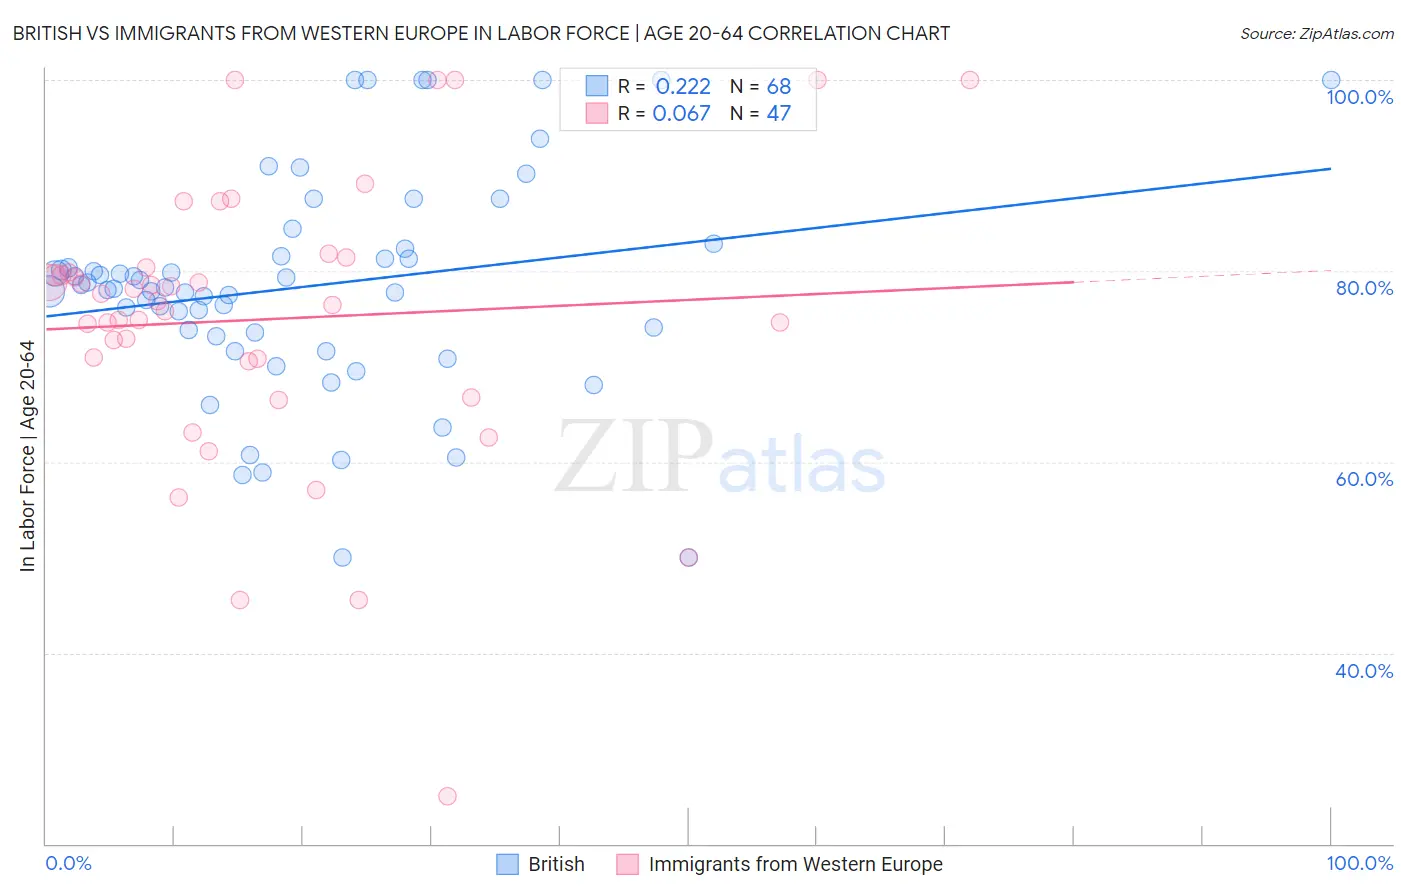
British vs Immigrants from Western Europe In Labor Force | Age 20-64 Correlation Chart
The statistical analysis conducted on geographies consisting of 531,500,819 people shows a weak positive correlation between the proportion of British and labor force participation rate among population between the ages 20 and 64 in the United States with a correlation coefficient (R) of 0.222 and weighted average of 79.3%. Similarly, the statistical analysis conducted on geographies consisting of 494,082,110 people shows a slight positive correlation between the proportion of Immigrants from Western Europe and labor force participation rate among population between the ages 20 and 64 in the United States with a correlation coefficient (R) of 0.067 and weighted average of 79.1%, a difference of 0.23%.
In Labor Force | Age 20-64 Correlation Summary
| Measurement | British | Immigrants from Western Europe |
| Minimum | 50.0% | 25.0% |
| Maximum | 100.0% | 100.0% |
| Range | 50.0% | 75.0% |
| Mean | 78.3% | 74.9% |
| Median | 78.2% | 76.8% |
| Interquartile 25% (IQ1) | 73.4% | 70.6% |
| Interquartile 75% (IQ3) | 81.9% | 80.3% |
| Interquartile Range (IQR) | 8.6% | 9.8% |
| Standard Deviation (Sample) | 11.4% | 15.0% |
| Standard Deviation (Population) | 11.3% | 14.8% |
Demographics Similar to British and Immigrants from Western Europe by In Labor Force | Age 20-64
In terms of in labor force | age 20-64, the demographic groups most similar to British are Subsaharan African (79.3%, a difference of 0.0%), Bangladeshi (79.3%, a difference of 0.0%), Haitian (79.3%, a difference of 0.010%), European (79.3%, a difference of 0.020%), and Irish (79.3%, a difference of 0.050%). Similarly, the demographic groups most similar to Immigrants from Western Europe are Central American (79.1%, a difference of 0.0%), Portuguese (79.1%, a difference of 0.020%), Immigrants from Panama (79.1%, a difference of 0.030%), Canadian (79.1%, a difference of 0.030%), and Immigrants from Uzbekistan (79.1%, a difference of 0.030%).
| Demographics | Rating | Rank | In Labor Force | Age 20-64 |
| Sub-Saharan Africans | 16.5 /100 | #207 | Poor 79.3% |
| British | 16.5 /100 | #208 | Poor 79.3% |
| Bangladeshis | 16.4 /100 | #209 | Poor 79.3% |
| Haitians | 16.1 /100 | #210 | Poor 79.3% |
| Europeans | 15.3 /100 | #211 | Poor 79.3% |
| Irish | 13.2 /100 | #212 | Poor 79.3% |
| Immigrants | Portugal | 12.8 /100 | #213 | Poor 79.3% |
| Immigrants | Armenia | 12.2 /100 | #214 | Poor 79.2% |
| Immigrants | Norway | 12.0 /100 | #215 | Poor 79.2% |
| Arabs | 11.4 /100 | #216 | Poor 79.2% |
| Immigrants | Western Asia | 11.0 /100 | #217 | Poor 79.2% |
| Immigrants | England | 9.3 /100 | #218 | Tragic 79.2% |
| French Canadians | 8.4 /100 | #219 | Tragic 79.2% |
| Immigrants | Immigrants | 7.7 /100 | #220 | Tragic 79.2% |
| Hungarians | 7.2 /100 | #221 | Tragic 79.2% |
| Immigrants | Panama | 6.9 /100 | #222 | Tragic 79.1% |
| Canadians | 6.8 /100 | #223 | Tragic 79.1% |
| Immigrants | Uzbekistan | 6.8 /100 | #224 | Tragic 79.1% |
| Portuguese | 6.4 /100 | #225 | Tragic 79.1% |
| Central Americans | 5.9 /100 | #226 | Tragic 79.1% |
| Immigrants | Western Europe | 5.9 /100 | #227 | Tragic 79.1% |