Immigrants from Congo vs Immigrants from Western Europe In Labor Force | Age 20-64
COMPARE
Immigrants from Congo
Immigrants from Western Europe
In Labor Force | Age 20-64
In Labor Force | Age 20-64 Comparison
Immigrants from Congo
Immigrants from Western Europe
79.3%
IN LABOR FORCE | AGE 20-64
17.5/ 100
METRIC RATING
205th/ 347
METRIC RANK
79.1%
IN LABOR FORCE | AGE 20-64
5.9/ 100
METRIC RATING
227th/ 347
METRIC RANK
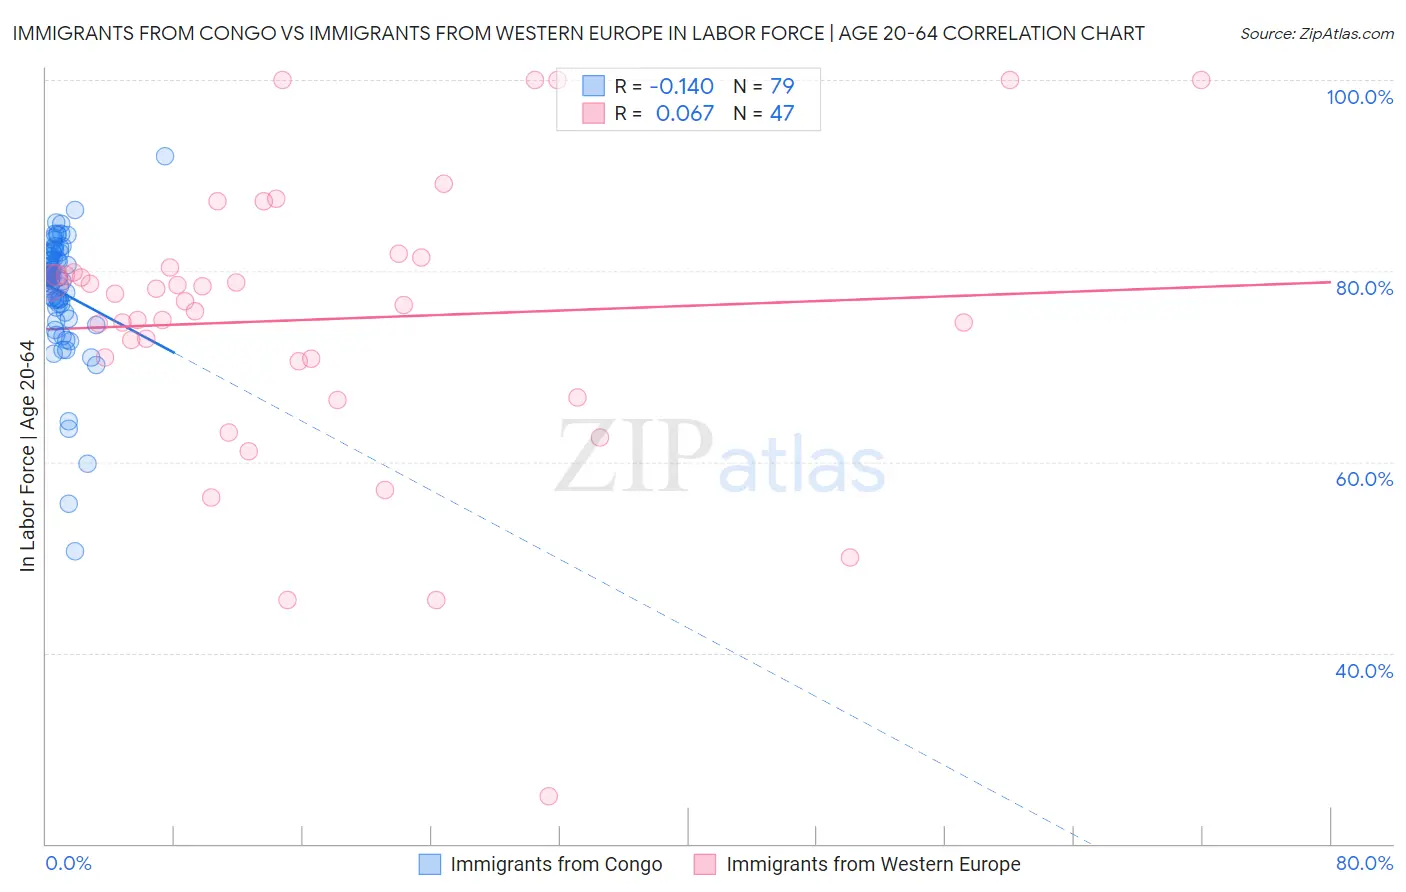
Immigrants from Congo vs Immigrants from Western Europe In Labor Force | Age 20-64 Correlation Chart
The statistical analysis conducted on geographies consisting of 92,129,118 people shows a poor negative correlation between the proportion of Immigrants from Congo and labor force participation rate among population between the ages 20 and 64 in the United States with a correlation coefficient (R) of -0.140 and weighted average of 79.3%. Similarly, the statistical analysis conducted on geographies consisting of 494,082,110 people shows a slight positive correlation between the proportion of Immigrants from Western Europe and labor force participation rate among population between the ages 20 and 64 in the United States with a correlation coefficient (R) of 0.067 and weighted average of 79.1%, a difference of 0.25%.
In Labor Force | Age 20-64 Correlation Summary
| Measurement | Immigrants from Congo | Immigrants from Western Europe |
| Minimum | 50.6% | 25.0% |
| Maximum | 92.0% | 100.0% |
| Range | 41.4% | 75.0% |
| Mean | 77.8% | 74.9% |
| Median | 79.3% | 76.8% |
| Interquartile 25% (IQ1) | 76.1% | 70.6% |
| Interquartile 75% (IQ3) | 81.5% | 80.3% |
| Interquartile Range (IQR) | 5.4% | 9.8% |
| Standard Deviation (Sample) | 6.4% | 15.0% |
| Standard Deviation (Population) | 6.4% | 14.8% |
Similar Demographics by In Labor Force | Age 20-64
Demographics Similar to Immigrants from Congo by In Labor Force | Age 20-64
In terms of in labor force | age 20-64, the demographic groups most similar to Immigrants from Congo are Iraqi (79.3%, a difference of 0.0%), Immigrants from Cambodia (79.3%, a difference of 0.0%), Nicaraguan (79.3%, a difference of 0.010%), Immigrants from Ecuador (79.3%, a difference of 0.010%), and Subsaharan African (79.3%, a difference of 0.010%).
| Demographics | Rating | Rank | In Labor Force | Age 20-64 |
| Immigrants | Laos | 21.5 /100 | #198 | Fair 79.4% |
| Dutch | 20.2 /100 | #199 | Fair 79.3% |
| Immigrants | Oceania | 19.1 /100 | #200 | Poor 79.3% |
| Immigrants | Nicaragua | 19.0 /100 | #201 | Poor 79.3% |
| Nicaraguans | 18.3 /100 | #202 | Poor 79.3% |
| Iraqis | 17.7 /100 | #203 | Poor 79.3% |
| Immigrants | Cambodia | 17.6 /100 | #204 | Poor 79.3% |
| Immigrants | Congo | 17.5 /100 | #205 | Poor 79.3% |
| Immigrants | Ecuador | 16.9 /100 | #206 | Poor 79.3% |
| Sub-Saharan Africans | 16.5 /100 | #207 | Poor 79.3% |
| British | 16.5 /100 | #208 | Poor 79.3% |
| Bangladeshis | 16.4 /100 | #209 | Poor 79.3% |
| Haitians | 16.1 /100 | #210 | Poor 79.3% |
| Europeans | 15.3 /100 | #211 | Poor 79.3% |
| Irish | 13.2 /100 | #212 | Poor 79.3% |
Demographics Similar to Immigrants from Western Europe by In Labor Force | Age 20-64
In terms of in labor force | age 20-64, the demographic groups most similar to Immigrants from Western Europe are Central American (79.1%, a difference of 0.0%), Panamanian (79.1%, a difference of 0.010%), Alsatian (79.1%, a difference of 0.010%), Native Hawaiian (79.1%, a difference of 0.010%), and Portuguese (79.1%, a difference of 0.020%).
| Demographics | Rating | Rank | In Labor Force | Age 20-64 |
| Immigrants | Immigrants | 7.7 /100 | #220 | Tragic 79.2% |
| Hungarians | 7.2 /100 | #221 | Tragic 79.2% |
| Immigrants | Panama | 6.9 /100 | #222 | Tragic 79.1% |
| Canadians | 6.8 /100 | #223 | Tragic 79.1% |
| Immigrants | Uzbekistan | 6.8 /100 | #224 | Tragic 79.1% |
| Portuguese | 6.4 /100 | #225 | Tragic 79.1% |
| Central Americans | 5.9 /100 | #226 | Tragic 79.1% |
| Immigrants | Western Europe | 5.9 /100 | #227 | Tragic 79.1% |
| Panamanians | 5.7 /100 | #228 | Tragic 79.1% |
| Alsatians | 5.7 /100 | #229 | Tragic 79.1% |
| Native Hawaiians | 5.6 /100 | #230 | Tragic 79.1% |
| Lebanese | 5.1 /100 | #231 | Tragic 79.1% |
| Guamanians/Chamorros | 4.5 /100 | #232 | Tragic 79.1% |
| Japanese | 4.0 /100 | #233 | Tragic 79.1% |
| Immigrants | Canada | 3.2 /100 | #234 | Tragic 79.0% |