English vs Immigrants from Western Europe In Labor Force | Age 20-64
COMPARE
English
Immigrants from Western Europe
In Labor Force | Age 20-64
In Labor Force | Age 20-64 Comparison
English
Immigrants from Western Europe
78.8%
IN LABOR FORCE | AGE 20-64
0.9/ 100
METRIC RATING
249th/ 347
METRIC RANK
79.1%
IN LABOR FORCE | AGE 20-64
5.9/ 100
METRIC RATING
227th/ 347
METRIC RANK
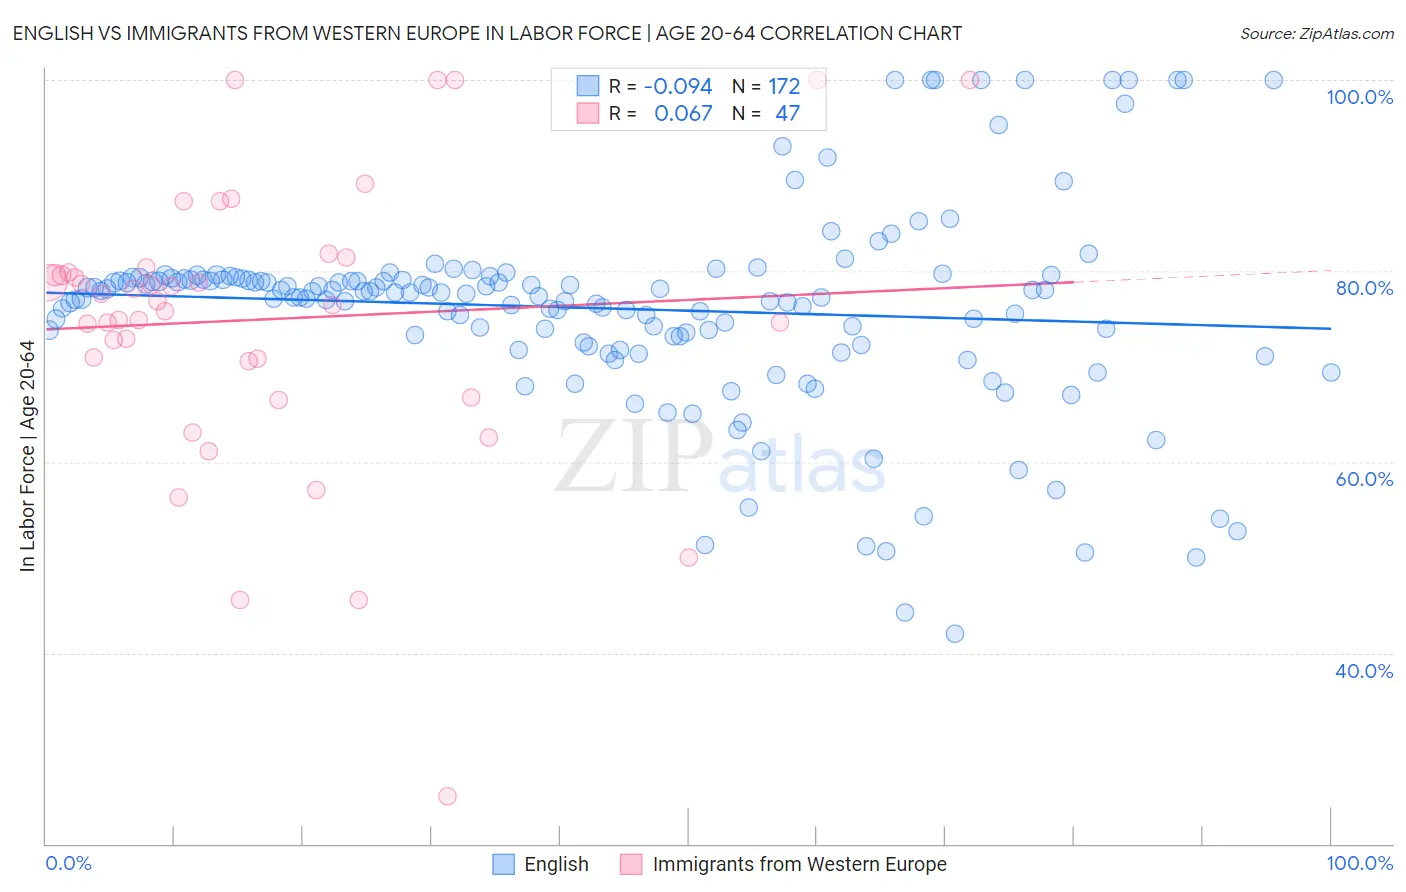
English vs Immigrants from Western Europe In Labor Force | Age 20-64 Correlation Chart
The statistical analysis conducted on geographies consisting of 579,959,630 people shows a slight negative correlation between the proportion of English and labor force participation rate among population between the ages 20 and 64 in the United States with a correlation coefficient (R) of -0.094 and weighted average of 78.8%. Similarly, the statistical analysis conducted on geographies consisting of 494,082,110 people shows a slight positive correlation between the proportion of Immigrants from Western Europe and labor force participation rate among population between the ages 20 and 64 in the United States with a correlation coefficient (R) of 0.067 and weighted average of 79.1%, a difference of 0.40%.
In Labor Force | Age 20-64 Correlation Summary
| Measurement | English | Immigrants from Western Europe |
| Minimum | 42.0% | 25.0% |
| Maximum | 100.0% | 100.0% |
| Range | 58.0% | 75.0% |
| Mean | 76.1% | 74.9% |
| Median | 77.7% | 76.8% |
| Interquartile 25% (IQ1) | 72.8% | 70.6% |
| Interquartile 75% (IQ3) | 79.1% | 80.3% |
| Interquartile Range (IQR) | 6.3% | 9.8% |
| Standard Deviation (Sample) | 10.5% | 15.0% |
| Standard Deviation (Population) | 10.4% | 14.8% |
Similar Demographics by In Labor Force | Age 20-64
Demographics Similar to English by In Labor Force | Age 20-64
In terms of in labor force | age 20-64, the demographic groups most similar to English are Honduran (78.8%, a difference of 0.0%), Immigrants from Germany (78.8%, a difference of 0.030%), Immigrants from Caribbean (78.8%, a difference of 0.030%), Barbadian (78.8%, a difference of 0.030%), and Immigrants from Trinidad and Tobago (78.8%, a difference of 0.050%).
| Demographics | Rating | Rank | In Labor Force | Age 20-64 |
| Immigrants | Micronesia | 1.9 /100 | #242 | Tragic 78.9% |
| Immigrants | West Indies | 1.7 /100 | #243 | Tragic 78.9% |
| French | 1.5 /100 | #244 | Tragic 78.9% |
| Scottish | 1.3 /100 | #245 | Tragic 78.9% |
| Immigrants | Trinidad and Tobago | 1.1 /100 | #246 | Tragic 78.8% |
| Immigrants | Germany | 1.0 /100 | #247 | Tragic 78.8% |
| Immigrants | Caribbean | 1.0 /100 | #248 | Tragic 78.8% |
| English | 0.9 /100 | #249 | Tragic 78.8% |
| Hondurans | 0.8 /100 | #250 | Tragic 78.8% |
| Barbadians | 0.7 /100 | #251 | Tragic 78.8% |
| Immigrants | Honduras | 0.6 /100 | #252 | Tragic 78.7% |
| Basques | 0.5 /100 | #253 | Tragic 78.7% |
| Immigrants | Lebanon | 0.5 /100 | #254 | Tragic 78.7% |
| Hawaiians | 0.5 /100 | #255 | Tragic 78.7% |
| Celtics | 0.5 /100 | #256 | Tragic 78.7% |
Demographics Similar to Immigrants from Western Europe by In Labor Force | Age 20-64
In terms of in labor force | age 20-64, the demographic groups most similar to Immigrants from Western Europe are Central American (79.1%, a difference of 0.0%), Panamanian (79.1%, a difference of 0.010%), Alsatian (79.1%, a difference of 0.010%), Native Hawaiian (79.1%, a difference of 0.010%), and Portuguese (79.1%, a difference of 0.020%).
| Demographics | Rating | Rank | In Labor Force | Age 20-64 |
| Immigrants | Immigrants | 7.7 /100 | #220 | Tragic 79.2% |
| Hungarians | 7.2 /100 | #221 | Tragic 79.2% |
| Immigrants | Panama | 6.9 /100 | #222 | Tragic 79.1% |
| Canadians | 6.8 /100 | #223 | Tragic 79.1% |
| Immigrants | Uzbekistan | 6.8 /100 | #224 | Tragic 79.1% |
| Portuguese | 6.4 /100 | #225 | Tragic 79.1% |
| Central Americans | 5.9 /100 | #226 | Tragic 79.1% |
| Immigrants | Western Europe | 5.9 /100 | #227 | Tragic 79.1% |
| Panamanians | 5.7 /100 | #228 | Tragic 79.1% |
| Alsatians | 5.7 /100 | #229 | Tragic 79.1% |
| Native Hawaiians | 5.6 /100 | #230 | Tragic 79.1% |
| Lebanese | 5.1 /100 | #231 | Tragic 79.1% |
| Guamanians/Chamorros | 4.5 /100 | #232 | Tragic 79.1% |
| Japanese | 4.0 /100 | #233 | Tragic 79.1% |
| Immigrants | Canada | 3.2 /100 | #234 | Tragic 79.0% |