Scandinavian vs Scottish In Labor Force | Age 20-64
COMPARE
Scandinavian
Scottish
In Labor Force | Age 20-64
In Labor Force | Age 20-64 Comparison
Scandinavians
Scottish
79.7%
IN LABOR FORCE | AGE 20-64
72.0/ 100
METRIC RATING
151st/ 347
METRIC RANK
78.9%
IN LABOR FORCE | AGE 20-64
1.3/ 100
METRIC RATING
245th/ 347
METRIC RANK
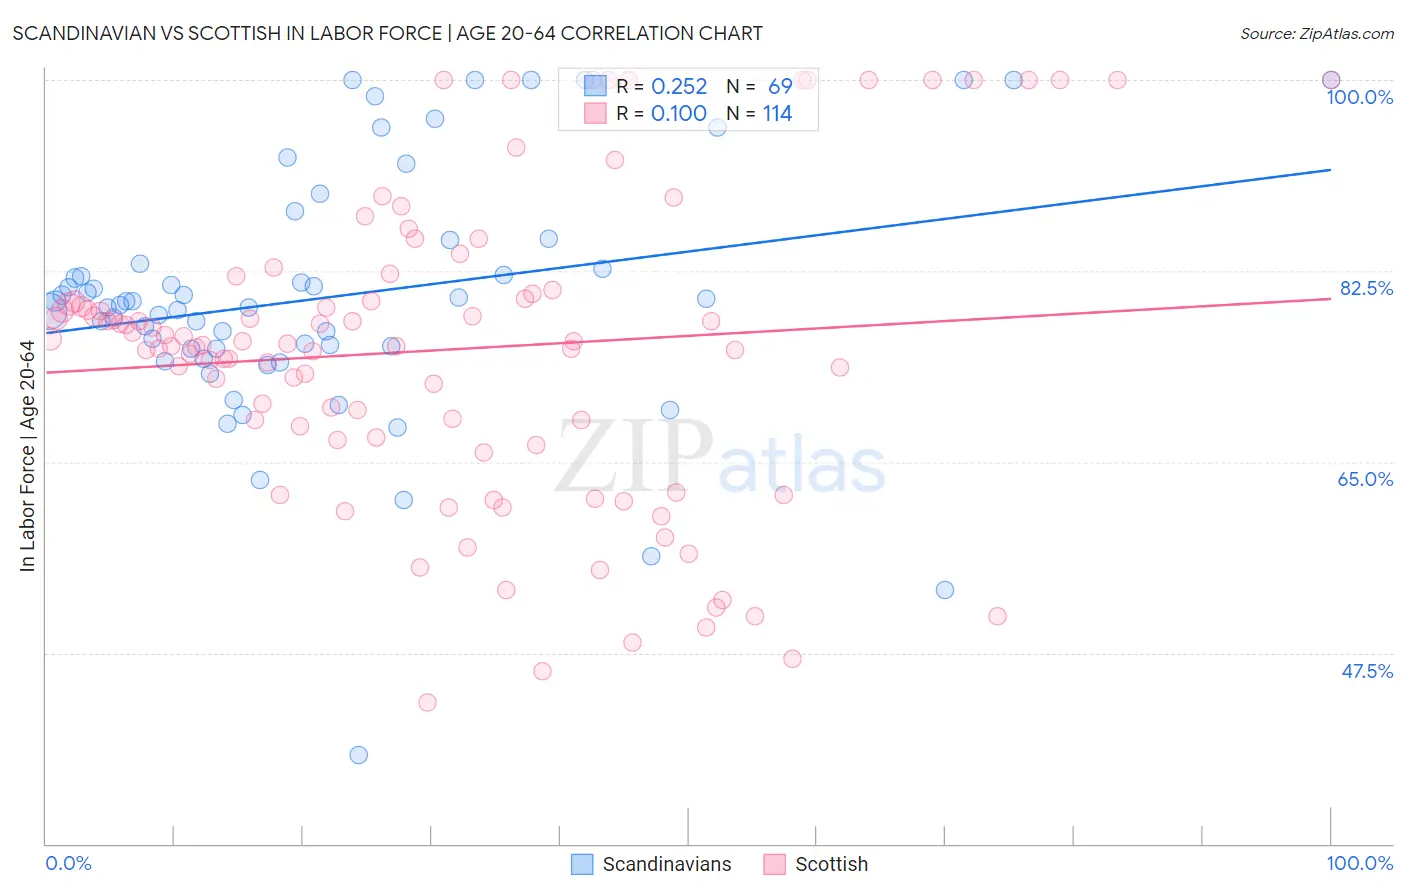
Scandinavian vs Scottish In Labor Force | Age 20-64 Correlation Chart
The statistical analysis conducted on geographies consisting of 472,639,714 people shows a weak positive correlation between the proportion of Scandinavians and labor force participation rate among population between the ages 20 and 64 in the United States with a correlation coefficient (R) of 0.252 and weighted average of 79.7%. Similarly, the statistical analysis conducted on geographies consisting of 567,150,822 people shows a poor positive correlation between the proportion of Scottish and labor force participation rate among population between the ages 20 and 64 in the United States with a correlation coefficient (R) of 0.100 and weighted average of 78.9%, a difference of 1.1%.
In Labor Force | Age 20-64 Correlation Summary
| Measurement | Scandinavian | Scottish |
| Minimum | 38.1% | 42.9% |
| Maximum | 100.0% | 100.0% |
| Range | 61.9% | 57.1% |
| Mean | 80.1% | 75.3% |
| Median | 79.7% | 75.9% |
| Interquartile 25% (IQ1) | 75.4% | 67.3% |
| Interquartile 75% (IQ3) | 84.3% | 80.4% |
| Interquartile Range (IQR) | 8.9% | 13.2% |
| Standard Deviation (Sample) | 11.6% | 13.9% |
| Standard Deviation (Population) | 11.5% | 13.9% |
Similar Demographics by In Labor Force | Age 20-64
Demographics Similar to Scandinavians by In Labor Force | Age 20-64
In terms of in labor force | age 20-64, the demographic groups most similar to Scandinavians are Costa Rican (79.7%, a difference of 0.0%), Immigrants from Northern Europe (79.7%, a difference of 0.0%), Immigrants from Kazakhstan (79.7%, a difference of 0.020%), Icelander (79.7%, a difference of 0.030%), and New Zealander (79.7%, a difference of 0.030%).
| Demographics | Rating | Rank | In Labor Force | Age 20-64 |
| Koreans | 79.6 /100 | #144 | Good 79.8% |
| Pakistanis | 79.3 /100 | #145 | Good 79.8% |
| Immigrants | Southern Europe | 78.9 /100 | #146 | Good 79.8% |
| Immigrants | Philippines | 78.0 /100 | #147 | Good 79.8% |
| Romanians | 77.6 /100 | #148 | Good 79.8% |
| Icelanders | 75.1 /100 | #149 | Good 79.7% |
| Costa Ricans | 72.4 /100 | #150 | Good 79.7% |
| Scandinavians | 72.0 /100 | #151 | Good 79.7% |
| Immigrants | Northern Europe | 72.0 /100 | #152 | Good 79.7% |
| Immigrants | Kazakhstan | 69.5 /100 | #153 | Good 79.7% |
| New Zealanders | 69.4 /100 | #154 | Good 79.7% |
| Immigrants | South Africa | 69.2 /100 | #155 | Good 79.7% |
| Senegalese | 69.1 /100 | #156 | Good 79.7% |
| Immigrants | China | 69.1 /100 | #157 | Good 79.7% |
| Austrians | 67.6 /100 | #158 | Good 79.7% |
Demographics Similar to Scottish by In Labor Force | Age 20-64
In terms of in labor force | age 20-64, the demographic groups most similar to Scottish are Immigrants from Trinidad and Tobago (78.8%, a difference of 0.030%), French (78.9%, a difference of 0.040%), Immigrants from Germany (78.8%, a difference of 0.040%), Immigrants from Caribbean (78.8%, a difference of 0.050%), and Immigrants from West Indies (78.9%, a difference of 0.070%).
| Demographics | Rating | Rank | In Labor Force | Age 20-64 |
| Immigrants | Jamaica | 2.6 /100 | #238 | Tragic 79.0% |
| Welsh | 2.4 /100 | #239 | Tragic 79.0% |
| Trinidadians and Tobagonians | 2.3 /100 | #240 | Tragic 79.0% |
| Jamaicans | 2.0 /100 | #241 | Tragic 78.9% |
| Immigrants | Micronesia | 1.9 /100 | #242 | Tragic 78.9% |
| Immigrants | West Indies | 1.7 /100 | #243 | Tragic 78.9% |
| French | 1.5 /100 | #244 | Tragic 78.9% |
| Scottish | 1.3 /100 | #245 | Tragic 78.9% |
| Immigrants | Trinidad and Tobago | 1.1 /100 | #246 | Tragic 78.8% |
| Immigrants | Germany | 1.0 /100 | #247 | Tragic 78.8% |
| Immigrants | Caribbean | 1.0 /100 | #248 | Tragic 78.8% |
| English | 0.9 /100 | #249 | Tragic 78.8% |
| Hondurans | 0.8 /100 | #250 | Tragic 78.8% |
| Barbadians | 0.7 /100 | #251 | Tragic 78.8% |
| Immigrants | Honduras | 0.6 /100 | #252 | Tragic 78.7% |