Scandinavian vs Paiute In Labor Force | Age 20-64
COMPARE
Scandinavian
Paiute
In Labor Force | Age 20-64
In Labor Force | Age 20-64 Comparison
Scandinavians
Paiute
79.7%
IN LABOR FORCE | AGE 20-64
72.0/ 100
METRIC RATING
151st/ 347
METRIC RANK
74.7%
IN LABOR FORCE | AGE 20-64
0.0/ 100
METRIC RATING
331st/ 347
METRIC RANK
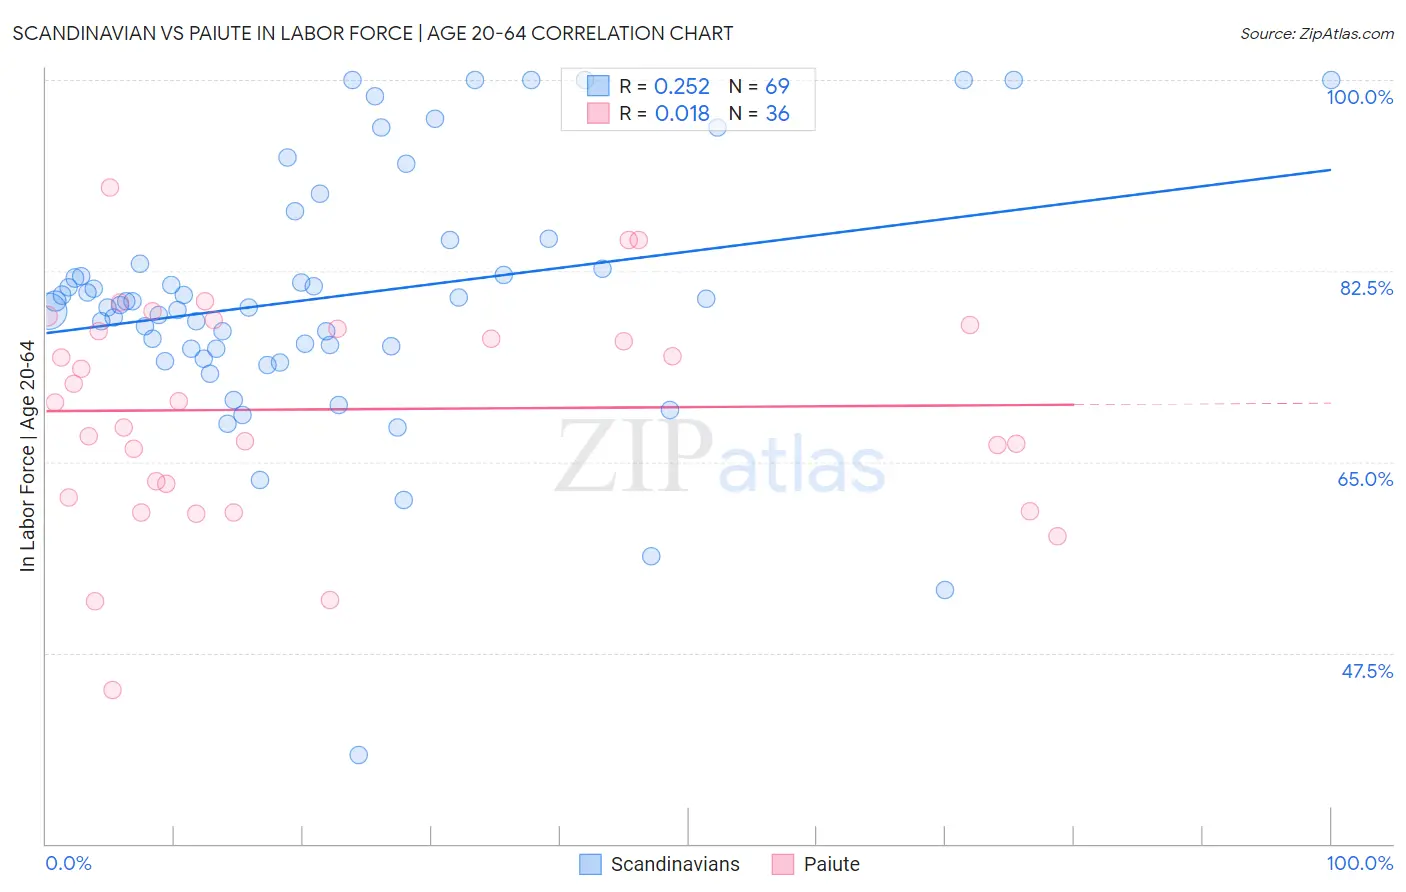
Scandinavian vs Paiute In Labor Force | Age 20-64 Correlation Chart
The statistical analysis conducted on geographies consisting of 472,639,714 people shows a weak positive correlation between the proportion of Scandinavians and labor force participation rate among population between the ages 20 and 64 in the United States with a correlation coefficient (R) of 0.252 and weighted average of 79.7%. Similarly, the statistical analysis conducted on geographies consisting of 58,399,197 people shows no correlation between the proportion of Paiute and labor force participation rate among population between the ages 20 and 64 in the United States with a correlation coefficient (R) of 0.018 and weighted average of 74.7%, a difference of 6.7%.
In Labor Force | Age 20-64 Correlation Summary
| Measurement | Scandinavian | Paiute |
| Minimum | 38.1% | 44.1% |
| Maximum | 100.0% | 90.1% |
| Range | 61.9% | 46.0% |
| Mean | 80.1% | 69.8% |
| Median | 79.7% | 70.5% |
| Interquartile 25% (IQ1) | 75.4% | 62.4% |
| Interquartile 75% (IQ3) | 84.3% | 77.4% |
| Interquartile Range (IQR) | 8.9% | 15.0% |
| Standard Deviation (Sample) | 11.6% | 10.1% |
| Standard Deviation (Population) | 11.5% | 10.0% |
Similar Demographics by In Labor Force | Age 20-64
Demographics Similar to Scandinavians by In Labor Force | Age 20-64
In terms of in labor force | age 20-64, the demographic groups most similar to Scandinavians are Costa Rican (79.7%, a difference of 0.0%), Immigrants from Northern Europe (79.7%, a difference of 0.0%), Immigrants from Kazakhstan (79.7%, a difference of 0.020%), Icelander (79.7%, a difference of 0.030%), and New Zealander (79.7%, a difference of 0.030%).
| Demographics | Rating | Rank | In Labor Force | Age 20-64 |
| Koreans | 79.6 /100 | #144 | Good 79.8% |
| Pakistanis | 79.3 /100 | #145 | Good 79.8% |
| Immigrants | Southern Europe | 78.9 /100 | #146 | Good 79.8% |
| Immigrants | Philippines | 78.0 /100 | #147 | Good 79.8% |
| Romanians | 77.6 /100 | #148 | Good 79.8% |
| Icelanders | 75.1 /100 | #149 | Good 79.7% |
| Costa Ricans | 72.4 /100 | #150 | Good 79.7% |
| Scandinavians | 72.0 /100 | #151 | Good 79.7% |
| Immigrants | Northern Europe | 72.0 /100 | #152 | Good 79.7% |
| Immigrants | Kazakhstan | 69.5 /100 | #153 | Good 79.7% |
| New Zealanders | 69.4 /100 | #154 | Good 79.7% |
| Immigrants | South Africa | 69.2 /100 | #155 | Good 79.7% |
| Senegalese | 69.1 /100 | #156 | Good 79.7% |
| Immigrants | China | 69.1 /100 | #157 | Good 79.7% |
| Austrians | 67.6 /100 | #158 | Good 79.7% |
Demographics Similar to Paiute by In Labor Force | Age 20-64
In terms of in labor force | age 20-64, the demographic groups most similar to Paiute are Colville (74.8%, a difference of 0.13%), Cheyenne (74.8%, a difference of 0.20%), Kiowa (75.0%, a difference of 0.40%), Arapaho (74.4%, a difference of 0.40%), and Sioux (75.0%, a difference of 0.43%).
| Demographics | Rating | Rank | In Labor Force | Age 20-64 |
| Choctaw | 0.0 /100 | #324 | Tragic 75.4% |
| Menominee | 0.0 /100 | #325 | Tragic 75.3% |
| Creek | 0.0 /100 | #326 | Tragic 75.1% |
| Sioux | 0.0 /100 | #327 | Tragic 75.0% |
| Kiowa | 0.0 /100 | #328 | Tragic 75.0% |
| Cheyenne | 0.0 /100 | #329 | Tragic 74.8% |
| Colville | 0.0 /100 | #330 | Tragic 74.8% |
| Paiute | 0.0 /100 | #331 | Tragic 74.7% |
| Arapaho | 0.0 /100 | #332 | Tragic 74.4% |
| Natives/Alaskans | 0.0 /100 | #333 | Tragic 73.9% |
| Apache | 0.0 /100 | #334 | Tragic 73.7% |
| Ute | 0.0 /100 | #335 | Tragic 73.7% |
| Crow | 0.0 /100 | #336 | Tragic 73.3% |
| Yup'ik | 0.0 /100 | #337 | Tragic 73.2% |
| Puerto Ricans | 0.0 /100 | #338 | Tragic 73.1% |