Puget Sound Salish vs Thai In Labor Force | Age 45-54
COMPARE
Puget Sound Salish
Thai
In Labor Force | Age 45-54
In Labor Force | Age 45-54 Comparison
Puget Sound Salish
Thais
81.7%
IN LABOR FORCE | AGE 45-54
0.3/ 100
METRIC RATING
248th/ 347
METRIC RANK
84.3%
IN LABOR FORCE | AGE 45-54
100.0/ 100
METRIC RATING
11th/ 347
METRIC RANK
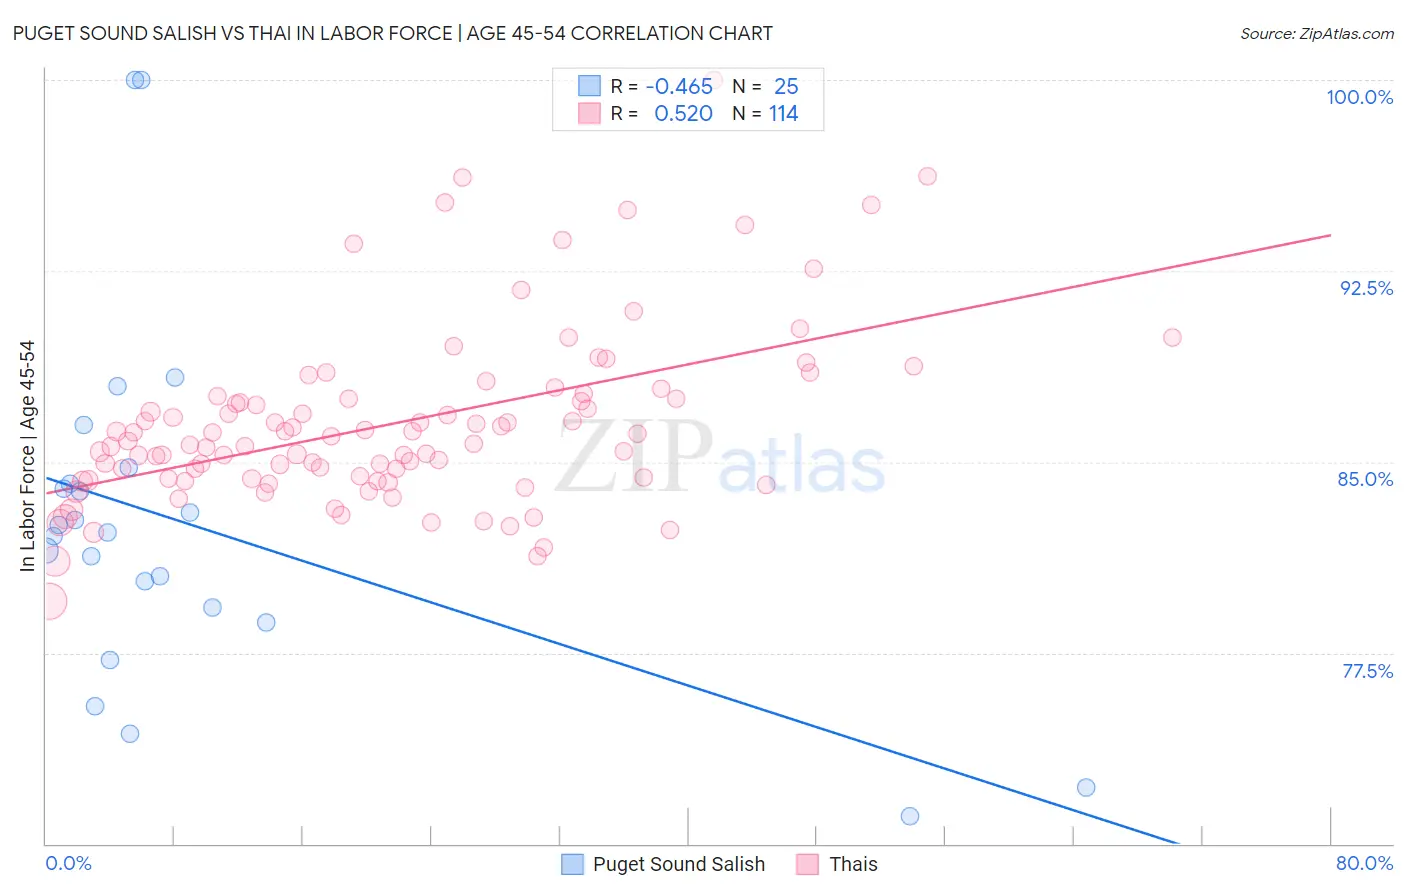
Puget Sound Salish vs Thai In Labor Force | Age 45-54 Correlation Chart
The statistical analysis conducted on geographies consisting of 46,155,746 people shows a moderate negative correlation between the proportion of Puget Sound Salish and labor force participation rate among population between the ages 45 and 54 in the United States with a correlation coefficient (R) of -0.465 and weighted average of 81.7%. Similarly, the statistical analysis conducted on geographies consisting of 475,327,867 people shows a substantial positive correlation between the proportion of Thais and labor force participation rate among population between the ages 45 and 54 in the United States with a correlation coefficient (R) of 0.520 and weighted average of 84.3%, a difference of 3.2%.
In Labor Force | Age 45-54 Correlation Summary
| Measurement | Puget Sound Salish | Thai |
| Minimum | 71.1% | 79.5% |
| Maximum | 100.0% | 100.0% |
| Range | 28.9% | 20.5% |
| Mean | 82.6% | 86.5% |
| Median | 82.2% | 85.8% |
| Interquartile 25% (IQ1) | 79.0% | 84.3% |
| Interquartile 75% (IQ3) | 84.5% | 87.5% |
| Interquartile Range (IQR) | 5.5% | 3.2% |
| Standard Deviation (Sample) | 6.8% | 3.5% |
| Standard Deviation (Population) | 6.7% | 3.5% |
Similar Demographics by In Labor Force | Age 45-54
Demographics Similar to Puget Sound Salish by In Labor Force | Age 45-54
In terms of in labor force | age 45-54, the demographic groups most similar to Puget Sound Salish are Central American (81.7%, a difference of 0.020%), Hmong (81.7%, a difference of 0.020%), Alaskan Athabascan (81.8%, a difference of 0.040%), Alaska Native (81.8%, a difference of 0.050%), and Celtic (81.8%, a difference of 0.060%).
| Demographics | Rating | Rank | In Labor Force | Age 45-54 |
| Immigrants | Cambodia | 0.8 /100 | #241 | Tragic 81.9% |
| Whites/Caucasians | 0.7 /100 | #242 | Tragic 81.9% |
| Samoans | 0.6 /100 | #243 | Tragic 81.8% |
| Celtics | 0.4 /100 | #244 | Tragic 81.8% |
| Alaska Natives | 0.4 /100 | #245 | Tragic 81.8% |
| Alaskan Athabascans | 0.4 /100 | #246 | Tragic 81.8% |
| Central Americans | 0.4 /100 | #247 | Tragic 81.7% |
| Puget Sound Salish | 0.3 /100 | #248 | Tragic 81.7% |
| Hmong | 0.3 /100 | #249 | Tragic 81.7% |
| Immigrants | Armenia | 0.2 /100 | #250 | Tragic 81.7% |
| Guamanians/Chamorros | 0.2 /100 | #251 | Tragic 81.6% |
| Pennsylvania Germans | 0.2 /100 | #252 | Tragic 81.6% |
| Japanese | 0.2 /100 | #253 | Tragic 81.6% |
| Immigrants | Laos | 0.2 /100 | #254 | Tragic 81.6% |
| Scotch-Irish | 0.2 /100 | #255 | Tragic 81.6% |
Demographics Similar to Thais by In Labor Force | Age 45-54
In terms of in labor force | age 45-54, the demographic groups most similar to Thais are Norwegian (84.4%, a difference of 0.090%), Immigrants from Sierra Leone (84.4%, a difference of 0.11%), Bulgarian (84.2%, a difference of 0.11%), Sierra Leonean (84.5%, a difference of 0.22%), and Chinese (84.1%, a difference of 0.22%).
| Demographics | Rating | Rank | In Labor Force | Age 45-54 |
| Immigrants | Ethiopia | 100.0 /100 | #4 | Exceptional 84.8% |
| Ethiopians | 100.0 /100 | #5 | Exceptional 84.8% |
| Immigrants | India | 100.0 /100 | #6 | Exceptional 84.7% |
| Immigrants | Cameroon | 100.0 /100 | #7 | Exceptional 84.6% |
| Sierra Leoneans | 100.0 /100 | #8 | Exceptional 84.5% |
| Immigrants | Sierra Leone | 100.0 /100 | #9 | Exceptional 84.4% |
| Norwegians | 100.0 /100 | #10 | Exceptional 84.4% |
| Thais | 100.0 /100 | #11 | Exceptional 84.3% |
| Bulgarians | 100.0 /100 | #12 | Exceptional 84.2% |
| Chinese | 99.9 /100 | #13 | Exceptional 84.1% |
| Cambodians | 99.9 /100 | #14 | Exceptional 84.1% |
| Cypriots | 99.9 /100 | #15 | Exceptional 84.1% |
| Immigrants | Nepal | 99.9 /100 | #16 | Exceptional 84.0% |
| Zimbabweans | 99.9 /100 | #17 | Exceptional 84.0% |
| Immigrants | South Central Asia | 99.9 /100 | #18 | Exceptional 84.0% |