Cheyenne vs Thai In Labor Force | Age 45-54
COMPARE
Cheyenne
Thai
In Labor Force | Age 45-54
In Labor Force | Age 45-54 Comparison
Cheyenne
Thais
77.6%
IN LABOR FORCE | AGE 45-54
0.0/ 100
METRIC RATING
330th/ 347
METRIC RANK
84.3%
IN LABOR FORCE | AGE 45-54
100.0/ 100
METRIC RATING
11th/ 347
METRIC RANK
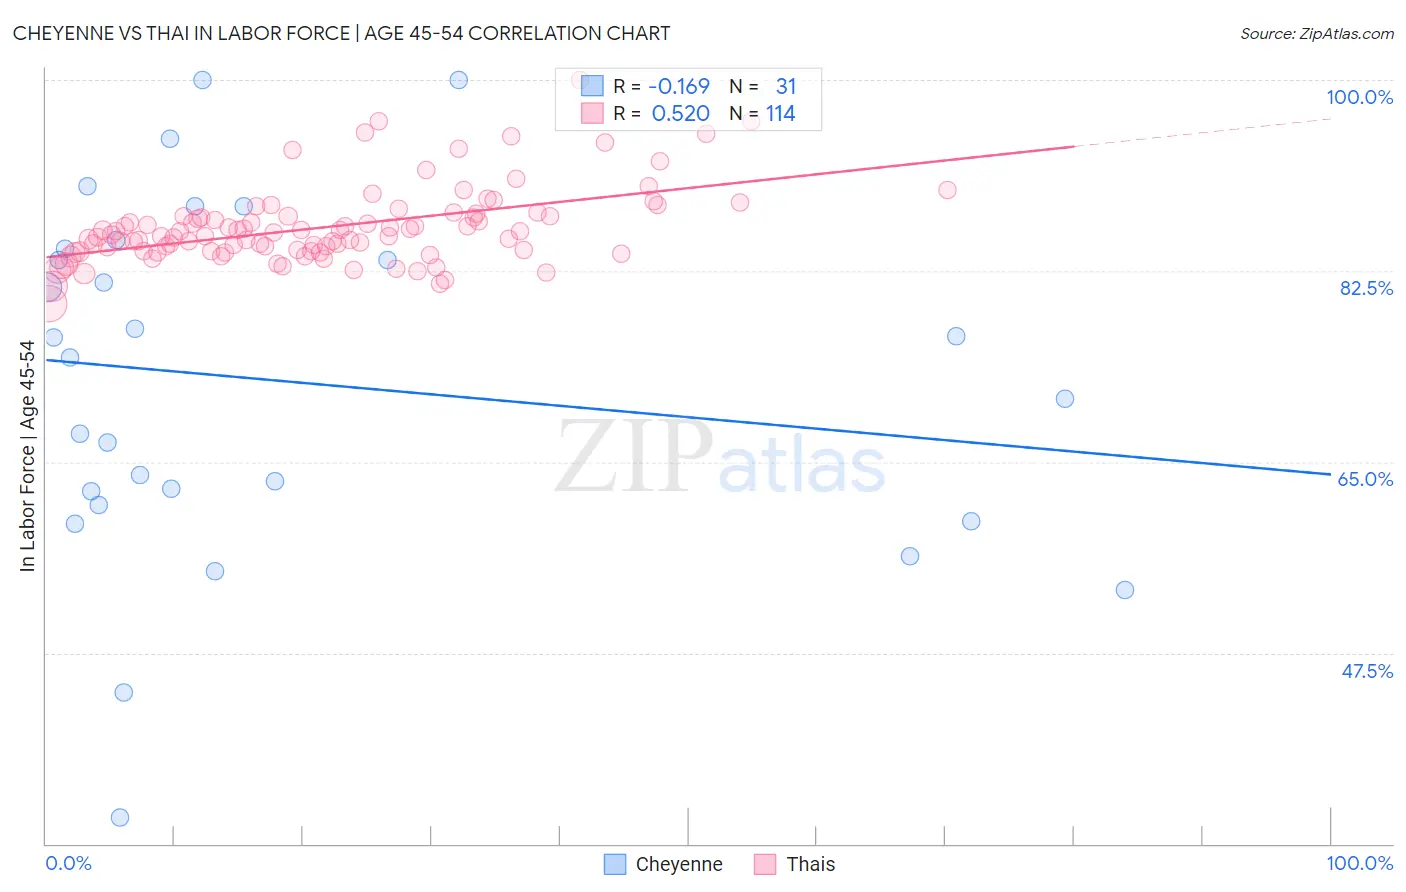
Cheyenne vs Thai In Labor Force | Age 45-54 Correlation Chart
The statistical analysis conducted on geographies consisting of 80,704,185 people shows a poor negative correlation between the proportion of Cheyenne and labor force participation rate among population between the ages 45 and 54 in the United States with a correlation coefficient (R) of -0.169 and weighted average of 77.6%. Similarly, the statistical analysis conducted on geographies consisting of 475,327,867 people shows a substantial positive correlation between the proportion of Thais and labor force participation rate among population between the ages 45 and 54 in the United States with a correlation coefficient (R) of 0.520 and weighted average of 84.3%, a difference of 8.7%.
In Labor Force | Age 45-54 Correlation Summary
| Measurement | Cheyenne | Thai |
| Minimum | 32.4% | 79.5% |
| Maximum | 100.0% | 100.0% |
| Range | 67.6% | 20.5% |
| Mean | 72.4% | 86.5% |
| Median | 74.5% | 85.8% |
| Interquartile 25% (IQ1) | 61.0% | 84.3% |
| Interquartile 75% (IQ3) | 84.5% | 87.5% |
| Interquartile Range (IQR) | 23.5% | 3.2% |
| Standard Deviation (Sample) | 16.2% | 3.5% |
| Standard Deviation (Population) | 15.9% | 3.5% |
Similar Demographics by In Labor Force | Age 45-54
Demographics Similar to Cheyenne by In Labor Force | Age 45-54
In terms of in labor force | age 45-54, the demographic groups most similar to Cheyenne are Tsimshian (77.4%, a difference of 0.15%), Menominee (77.4%, a difference of 0.18%), Creek (77.7%, a difference of 0.22%), Sioux (78.0%, a difference of 0.52%), and Native/Alaskan (77.1%, a difference of 0.54%).
| Demographics | Rating | Rank | In Labor Force | Age 45-54 |
| Kiowa | 0.0 /100 | #323 | Tragic 78.3% |
| Dutch West Indians | 0.0 /100 | #324 | Tragic 78.2% |
| Choctaw | 0.0 /100 | #325 | Tragic 78.2% |
| Seminole | 0.0 /100 | #326 | Tragic 78.1% |
| Cajuns | 0.0 /100 | #327 | Tragic 78.1% |
| Sioux | 0.0 /100 | #328 | Tragic 78.0% |
| Creek | 0.0 /100 | #329 | Tragic 77.7% |
| Cheyenne | 0.0 /100 | #330 | Tragic 77.6% |
| Tsimshian | 0.0 /100 | #331 | Tragic 77.4% |
| Menominee | 0.0 /100 | #332 | Tragic 77.4% |
| Natives/Alaskans | 0.0 /100 | #333 | Tragic 77.1% |
| Apache | 0.0 /100 | #334 | Tragic 77.1% |
| Arapaho | 0.0 /100 | #335 | Tragic 77.1% |
| Paiute | 0.0 /100 | #336 | Tragic 76.7% |
| Ute | 0.0 /100 | #337 | Tragic 76.6% |
Demographics Similar to Thais by In Labor Force | Age 45-54
In terms of in labor force | age 45-54, the demographic groups most similar to Thais are Norwegian (84.4%, a difference of 0.090%), Immigrants from Sierra Leone (84.4%, a difference of 0.11%), Bulgarian (84.2%, a difference of 0.11%), Sierra Leonean (84.5%, a difference of 0.22%), and Chinese (84.1%, a difference of 0.22%).
| Demographics | Rating | Rank | In Labor Force | Age 45-54 |
| Immigrants | Ethiopia | 100.0 /100 | #4 | Exceptional 84.8% |
| Ethiopians | 100.0 /100 | #5 | Exceptional 84.8% |
| Immigrants | India | 100.0 /100 | #6 | Exceptional 84.7% |
| Immigrants | Cameroon | 100.0 /100 | #7 | Exceptional 84.6% |
| Sierra Leoneans | 100.0 /100 | #8 | Exceptional 84.5% |
| Immigrants | Sierra Leone | 100.0 /100 | #9 | Exceptional 84.4% |
| Norwegians | 100.0 /100 | #10 | Exceptional 84.4% |
| Thais | 100.0 /100 | #11 | Exceptional 84.3% |
| Bulgarians | 100.0 /100 | #12 | Exceptional 84.2% |
| Chinese | 99.9 /100 | #13 | Exceptional 84.1% |
| Cambodians | 99.9 /100 | #14 | Exceptional 84.1% |
| Cypriots | 99.9 /100 | #15 | Exceptional 84.1% |
| Immigrants | Nepal | 99.9 /100 | #16 | Exceptional 84.0% |
| Zimbabweans | 99.9 /100 | #17 | Exceptional 84.0% |
| Immigrants | South Central Asia | 99.9 /100 | #18 | Exceptional 84.0% |