Puget Sound Salish vs Immigrants from Hungary In Labor Force | Age 45-54
COMPARE
Puget Sound Salish
Immigrants from Hungary
In Labor Force | Age 45-54
In Labor Force | Age 45-54 Comparison
Puget Sound Salish
Immigrants from Hungary
81.7%
IN LABOR FORCE | AGE 45-54
0.3/ 100
METRIC RATING
248th/ 347
METRIC RANK
82.7%
IN LABOR FORCE | AGE 45-54
37.1/ 100
METRIC RATING
182nd/ 347
METRIC RANK
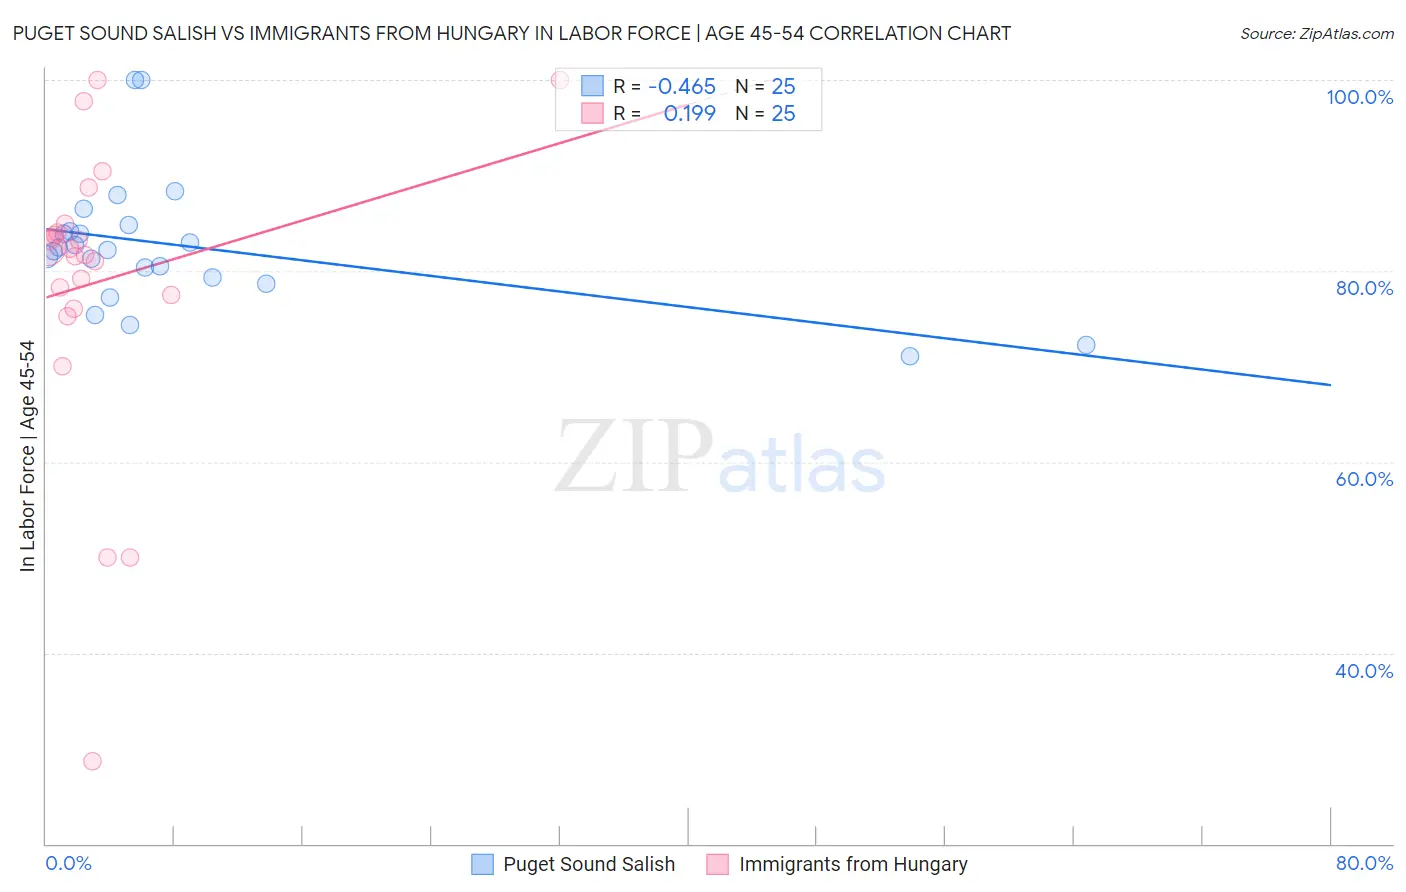
Puget Sound Salish vs Immigrants from Hungary In Labor Force | Age 45-54 Correlation Chart
The statistical analysis conducted on geographies consisting of 46,155,746 people shows a moderate negative correlation between the proportion of Puget Sound Salish and labor force participation rate among population between the ages 45 and 54 in the United States with a correlation coefficient (R) of -0.465 and weighted average of 81.7%. Similarly, the statistical analysis conducted on geographies consisting of 195,661,497 people shows a poor positive correlation between the proportion of Immigrants from Hungary and labor force participation rate among population between the ages 45 and 54 in the United States with a correlation coefficient (R) of 0.199 and weighted average of 82.7%, a difference of 1.1%.
In Labor Force | Age 45-54 Correlation Summary
| Measurement | Puget Sound Salish | Immigrants from Hungary |
| Minimum | 71.1% | 28.7% |
| Maximum | 100.0% | 100.0% |
| Range | 28.9% | 71.3% |
| Mean | 82.6% | 78.9% |
| Median | 82.2% | 82.3% |
| Interquartile 25% (IQ1) | 79.0% | 76.7% |
| Interquartile 75% (IQ3) | 84.5% | 84.5% |
| Interquartile Range (IQR) | 5.5% | 7.7% |
| Standard Deviation (Sample) | 6.8% | 15.8% |
| Standard Deviation (Population) | 6.7% | 15.4% |
Similar Demographics by In Labor Force | Age 45-54
Demographics Similar to Puget Sound Salish by In Labor Force | Age 45-54
In terms of in labor force | age 45-54, the demographic groups most similar to Puget Sound Salish are Central American (81.7%, a difference of 0.020%), Hmong (81.7%, a difference of 0.020%), Alaskan Athabascan (81.8%, a difference of 0.040%), Alaska Native (81.8%, a difference of 0.050%), and Celtic (81.8%, a difference of 0.060%).
| Demographics | Rating | Rank | In Labor Force | Age 45-54 |
| Immigrants | Cambodia | 0.8 /100 | #241 | Tragic 81.9% |
| Whites/Caucasians | 0.7 /100 | #242 | Tragic 81.9% |
| Samoans | 0.6 /100 | #243 | Tragic 81.8% |
| Celtics | 0.4 /100 | #244 | Tragic 81.8% |
| Alaska Natives | 0.4 /100 | #245 | Tragic 81.8% |
| Alaskan Athabascans | 0.4 /100 | #246 | Tragic 81.8% |
| Central Americans | 0.4 /100 | #247 | Tragic 81.7% |
| Puget Sound Salish | 0.3 /100 | #248 | Tragic 81.7% |
| Hmong | 0.3 /100 | #249 | Tragic 81.7% |
| Immigrants | Armenia | 0.2 /100 | #250 | Tragic 81.7% |
| Guamanians/Chamorros | 0.2 /100 | #251 | Tragic 81.6% |
| Pennsylvania Germans | 0.2 /100 | #252 | Tragic 81.6% |
| Japanese | 0.2 /100 | #253 | Tragic 81.6% |
| Immigrants | Laos | 0.2 /100 | #254 | Tragic 81.6% |
| Scotch-Irish | 0.2 /100 | #255 | Tragic 81.6% |
Demographics Similar to Immigrants from Hungary by In Labor Force | Age 45-54
In terms of in labor force | age 45-54, the demographic groups most similar to Immigrants from Hungary are Hungarian (82.7%, a difference of 0.010%), Israeli (82.7%, a difference of 0.010%), Immigrants from Switzerland (82.7%, a difference of 0.020%), Nigerian (82.7%, a difference of 0.030%), and New Zealander (82.6%, a difference of 0.040%).
| Demographics | Rating | Rank | In Labor Force | Age 45-54 |
| Immigrants | Liberia | 47.9 /100 | #175 | Average 82.7% |
| Northern Europeans | 46.9 /100 | #176 | Average 82.7% |
| Immigrants | Nicaragua | 44.6 /100 | #177 | Average 82.7% |
| Nigerians | 40.5 /100 | #178 | Average 82.7% |
| Immigrants | Switzerland | 39.4 /100 | #179 | Fair 82.7% |
| Hungarians | 38.0 /100 | #180 | Fair 82.7% |
| Israelis | 37.7 /100 | #181 | Fair 82.7% |
| Immigrants | Hungary | 37.1 /100 | #182 | Fair 82.7% |
| New Zealanders | 32.7 /100 | #183 | Fair 82.6% |
| Europeans | 32.6 /100 | #184 | Fair 82.6% |
| Immigrants | England | 32.2 /100 | #185 | Fair 82.6% |
| Irish | 29.2 /100 | #186 | Fair 82.6% |
| Immigrants | Costa Rica | 28.3 /100 | #187 | Fair 82.6% |
| South Africans | 28.0 /100 | #188 | Fair 82.6% |
| Syrians | 26.0 /100 | #189 | Fair 82.6% |